Download
1 / 1
10 likes | 113 Vues
TABLE II. Distribution of workers, farm work injuries, and injury rates for hired crop workers in the US by region, gender, race or ethnicity, education, migrant type, work experience, presence of a health condition, or a musculoskeletal complaint (NAWS, 1999, 2002-2004).

E N D
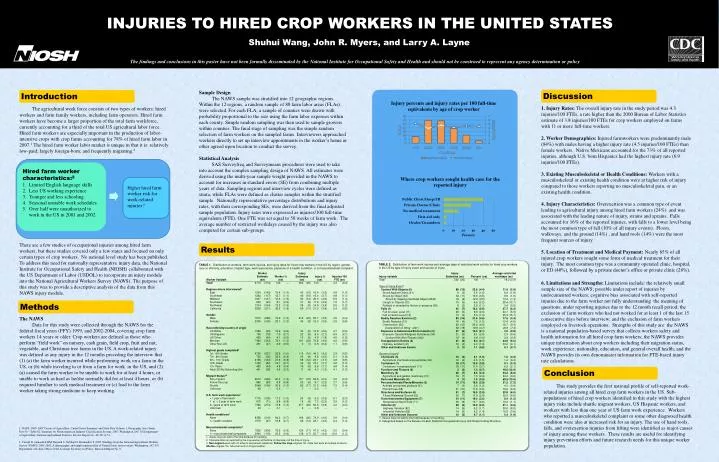
TABLE II. Distribution of workers, farm work injuries, and injury rates for hired crop workers in the US by region, gender, race or ethnicity, education, migrant type, work experience, presence of a health condition, or a musculoskeletal complaint (NAWS, 1999, 2002-2004). TABLE II. Distribution of workers, farm work injuries, and injury rates for hired crop workers in the US by region, gender, race or ethnicity, education, migrant type, work experience, presence of a health condition, or a musculoskeletal complaint (NAWS, 1999, 2002-2004). TABLE II. Distribution of workers, farm work injuries, and injury rates for hired crop workers in the US by region, gender, race or ethnicity, education, migrant type, work experience, presence of a health condition, or a musculoskeletal complaint (NAWS, 1999, 2002-2004). TABLE II. Distribution of workers, farm work injuries, and injury rates for hired crop workers in the US by region, gender, race or ethnicity, education, migrant type, work experience, presence of a health condition, or a musculoskeletal complaint (NAWS, 1999, 2002-2004). TABLE 2. Distribution of farm work injuries and average days of restricted work activity for hired crop workers in the US by type of injury event and source of injury (NAWS, 1999, 2002-2004). INJURIES TO HIRED CROP WORKERS IN THE UNITED STATES Injuries Rates Shuhui Wang, John R. Myers, and Larry A. Layne The findings and conclusions in this poster have not been formally disseminated by the National Institute for Occupational Safety and Health and should not be construed to represent any agency determination orpolicy Sample Design The NAWS sample was stratified into 12 geographic regions. Within the 12 regions, a random sample of 80 farm labor areas (FLAs) were selected. For each FLA, a sample of counties were drawn with probability proportional to the size using the farm labor expenses within each county. Simple random sampling was then used to sample growers within counties. The final stage of sampling was the simple random selection of farm workers on the sampled farms. Interviewers approached workers directly to set up interview appointments in the worker’s home or other agreed upon location to conduct the survey. Statistical Analysis SAS Surveyfreq and Surveymeans procedures were used to take into account the complex sampling design of NAWS. All estimates were derived using the multi-year sample weight provided in the NAWS to account for increases in standard errors (SE) from combining multiple years of data. Sampling regions and interview cycles were defined as strata, while FLAs were defined as cluster samples within the stratified sample. Nationally representative percentage distributions and injury rates, with their corresponding SEs, were derived from the final adjusted sample population. Injury rates were expressed as injuries/100 full-time equivalents (FTE). One FTE was set equal to 50 weeks of farm work. The average number of restricted workdays caused by the injury was also computed for certain sub-groups. Discussion Introduction Injury percents and injury rates per 100 full-time equivalents by age of crop worker • The agricultural work force consists of two types of workers: hired workers and farm family workers, including farm operators. Hired farm workers have become a larger proportion of the total farm workforce, currently accounting for a third of the total US agricultural labor force. Hired farm workers are especially important in the production of labor-intensive crops with crop farms accounting for 78% of hired farm labor in 2007.1 The hired farm worker labor market is unique in that it is: relatively low-paid; largely foreign-born; and frequently migrating.2 • There are a few studies of occupational injuries among hired farm workers, but these studies covered only a few states and focused on only certain types of crop workers. No national level study has been published. To address this need for nationally representative injury data, the National Institute for Occupational Safety and Health (NIOSH) collaborated with the US Department of Labor (USDOL) to incorporate an injury module into the National Agricultural Workers Survey (NAWS). The purpose of this study was to provide a descriptive analysis of the data from this NAWS injury module. 1. Injury Rates: The overall injury rate in the study period was 4.3 injuries/100 FTEs, a rate higher than the 2000 Bureau of Labor Statistics estimate of 3.8 injuries/100 FTEs for crop workers employed on farms with 11 or more full-time workers. 2. Worker Demographics: Injured farmworkers were predominantly male (84%) with males having a higher injury rate (4.5 injuries/100 FTEs) than female workers. Native Mexicans accounted for the 73% of all reported injuries, although U.S. born Hispanics had the highest injury rate (6.9 injuries/100 FTEs). 3. Existing Musculoskeletal or Health Conditions: Workers with a musculoskeletal or existing health condition were at higher risk of injury compared to those workers reporting no musculoskeletal pain, or an existing health condition. 4. Injury Characteristics: Overexertion was a common type of event leading to agricultural injury among hired farm workers (24%) and was associated with the leading nature of injury, strains and sprains. Falls accounted for 16% of the reported injuries, with falls to a lower level being the most common type of fall (10% of all injury events). Floors, walkways, and the ground (14%) , and hand tools (14%) were the most frequent sources of injury. 5. Location of Treatment and Medical Payment: Nearly 85% of all injured crop workers sought some form of medical treatment for their injury. The most common type was a community operated clinic, hospital, or ED (40%), followed by a private doctor’s office or private clinic (28%). 6. Limitations and Strengths: Limitations include: the relatively small sample size of the NAWS; possible under report of injuries by undocumented workers; cognitive bias associated with self-reported injuries due to the farm worker not fully understanding the meaning of questions; under reporting injuries due to the 12 month recall period; the exclusion of farm workers who had not worked for at least 1 of the last 15 consecutive days before interview; and the exclusion of farm workers employed on livestock operations. Strengths of this study are: the NAWS is a national population-based survey that collects workers safety and health information for all hired crop farm workers; the NAWS provides unique information about crop workers including their migration status, work experience, nationality, education, and general overall health; and the NAWS provides its own denominator information for FTE-based injury rate calculations. Where crop workers sought health care for the reported injury Hired farm worker characteristics:2 Limited English language skills Less US working experience Younger and less schooling Seasonal unstable work schedules Over half were unauthorized to work in the US in 2001 and 2002 Higher hired farm worker risk for work-related injuries? Results TABLE 2. Distribution of farm work injuries and average days of restricted work activity for hired crop workers in the US by type of injury event and source of injury. TABLE 1. Distribution of workers, farm work injuries, and injury rates for hired crop workers in the US by region, gender, race or ethnicity, education, migrant type, work experience, presence of a health condition, or a musculoskeletal complaint. Methods The NAWS Data for this study were collected through the NAWS for the federal fiscal years (FFY) 1999, and 2002-2004, covering crop farm workers 14 years or older. Crop workers are defined as those who perform “field work” on nursery, cash grain, field crop, fruit and nut, vegetable, and Christmas tree farms in the US. A work-related injury was defined as any injury in the 12 months preceding the interview that (1) (a) the farm worker incurred while performing work on a farm in the US, or (b) while traveling to or from a farm for work in the US, and (2) (a) caused the farm worker to be unable to work for at least 4 hours, or unable to work as hard as he/she normally did for at least 4 hours, or (b) required him/her to seek medical treatment or (c) lead to the farm worker taking strong medicine to keep working. Conclusion This study provides the first national profile of self-reported work-related injuries among all hired crop farm workers in the US. Sub-populations of hired crop workers identified in this study with the highest injury risks include shuttle migrant workers, US Hispanic workers, and workers with less than one year of US farm work experience. Workers who reported a musculoskeletal complaint or some other diagnosed health condition were also at increased risk for an injury. The use of hand tools, falls, and overexertion injuries from lifting were identified as major causes of injury among these workers. These results are useful for identifying injury prevention efforts and future research needs for this unique worker population. 1. NASS. 2009. 2007 Census of Agriculture, United States Summary and State Data Volume 1, Geographic Area Series Part 51—Table 62. Summary by North American Industry Classification System: 2007. Washington, DC: US Department of Agriculture, National Agricultural Statistics Service Report No. AC-07-A-51. 2. Carroll D, Samardick RM, Bernard S, Gabbard S, Hernandez T. 2005. Findings from the National Agricultural Workers Survey (NAWS) 2001-2002: A demographic and employment profile of United States farm workers. Washington, DC: US Department of Labor, Office of the Assistant Secretary for Policy, Research Report No. 9.