Download
1 / 41
410 likes | 567 Vues
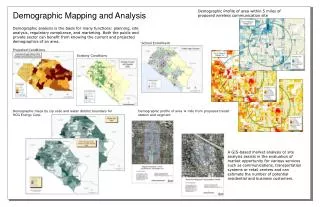
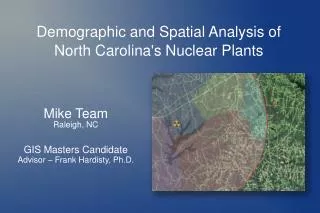
Demographic and Spatial Analysis of North Carolina's Nuclear Plants. Mike Team Raleigh, NC GIS Masters Candidate Advisor – Frank Hardisty, Ph.D. Overview. Background and study goals Demographic Analysis Spatial Analysis methods and results Benefit Cost Analysis. Study Goals.

E N D
Demographic and Spatial Analysis of North Carolina's Nuclear Plants Mike Team Raleigh, NC GIS Masters Candidate Advisor – Frank Hardisty, Ph.D.
Overview • Background and study goals • Demographic Analysis • Spatial Analysis methods and results • Benefit Cost Analysis
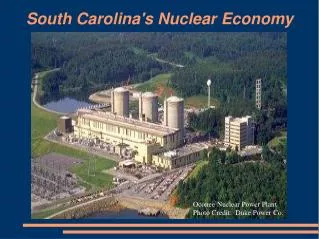
North Carolina Reactors Show map of regional reactor sites
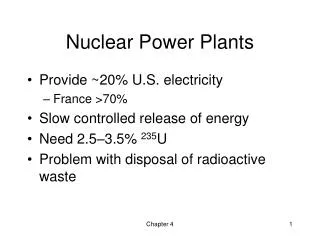
Population Data Sets • US Census – 2000 • Best "count" of US Population • Available free to the public • 10 year old data set
Population Data Sets • Estimated Population Data – 2008 • Estimate of US Population - based on 2000 census • US Gov't provides estimates to county level • Private data available for a fee
Population Data Sets • LandScan Ambient Data – 2008 • Compiled by Oak Ridge (TN) National Labs • Raster data – 30" x 30" (.0083 Decimal Degrees) • Free with approved registration
Reception Center Allocation • Cost Weighted Distance • Raster calculation • Calculates best path based on 'travel cost' • Weights assigned subjectively
Reception Center Allocation Cost Weighted Distance
Reception Center Allocation Cost Weighted Distance
Benefit Cost Analysis Comparing Energy Output with Population
Benefit Cost Analysis Comparing Population with Energy Output
Benefit Cost Analysis Comparing Population with Energy Output
Conclusion • Population Data Set Options • Demographic Analysis Data • Reception Center Allocation • Benefit Cost Assessment
Conclusion • Population Data Set Options • Demographic Analysis Data • Reception Center Allocation • Benefit Cost Assessment
Demographic and Spatial Analysis of North Carolina's Nuclear Plants Mike Team Raleigh, NC GIS Masters Candidate Advisor – Frank Hardisty, Ph.D.