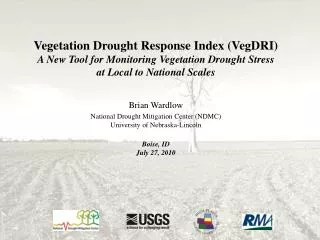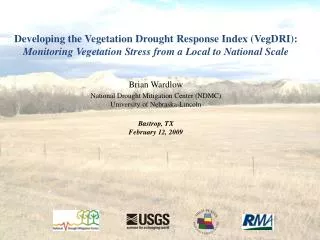
VegDRI Evaluation Network: Enhancing Accuracy Feedback
Join us in assessing VegDRI maps' accuracy locally across the U.S. to enhance agricultural and environmental decision-making. Share qualitative and quantitative feedback to improve map precision.

VegDRI Evaluation Network: Enhancing Accuracy Feedback
E N D
Presentation Transcript
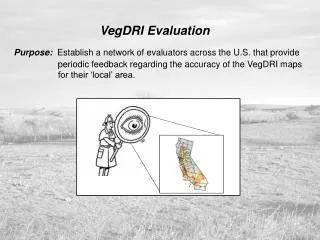
VegDRI Evaluation Purpose: Establish a network of evaluators across the U.S. that provide periodic feedback regarding the accuracy of the VegDRI maps for their ‘local’ area.
VegDRI Evaluation Purpose: Establish a network of evaluators across the U.S. that provide periodic feedback regarding the accuracy of the VegDRI maps for their ‘local’ area. Goal: Collect ‘baseline’ information about VegDRI’s performance and better understand the index’s current strengths and weaknesses. Types of feedback: 1) qualitative: - visual observations - photos - impacts (e.g., cattle sales & feed surplus/deficits) 2) quantitative: - clip plot data (e.g., biomass) - rainfall measurements & variations - production (e.g., ‘How yield/forage production compared to the average.’)
VegDRI Evaluation Feedback in 2008 from ~200 evaluators across a 22-state region. Composition: - farmers & ranchers - climate experts (state climatologists & USDM authors) - agricultural experts & university extensions specialists - natural resource managers - Workshops: 3 per year nationally 2006: Illinois, New Mexico, & Oklahoma 2007: North Dakota, Texas (San Angelo), & Wyoming 2008: Montana & Washington 2009: California, Texas (Bastrop) & eastern U.S. (state TBD)
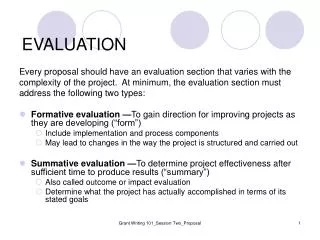
VegDRI Two Week Evaluation Form • Please limit your evaluation to the map released on________ . If you would like to comment on a previous map, please • use the general comment form. • Based on your style of Internet connection (e.g., dial-up, broadband, DSL, etc.) did you have problems accessing • the VegDRI mapping tool? • ○ Yes ○ No • If yes, what problems did you experience? • 2. Did you have problems with the functionality or navigating around the VegDRI mapping tool? • ○ Yes ○ No • If yes, what problems did you experience? • 3. How accurately does the VegDRI image released on reflect conditions in your county or region? • ○1 ○2 ○3 ○4 ○5 ○6 ○7 • Very inaccurateModerately accurateVery accurate • Comments on areas (e.g., northeast section of Lancaster county) that VegDRI accurately (e.g., VegDRI and observed • normal) represented conditions.
VegDRI #3 PR #2 W T #1 C Wyoming June 4, 2007 Evaluator Comments “Cheyenne is quickly degrading in terms of greenness (now about 2 inches below normal precipitation after being normal on April 1). Vegetation is quickly browning out.” (#1) “At our Nunn, CO site things have markedly browned in the last week. Also, just got back from a trip to Thermopolis and the area from Wheatland to about 30 miles west of Casper is green and in good shape (#2), the area west of Casper from Powder River to Thermopolis is very dry - vegetation is very brown, the cheatgrass is brown, no new green growth there (#3).” - USDA ARS scientist Source: visual scan VegDRI for June 4
Nebraska July 16, 2007 Evaluator Comments “Our ranch is a block extending into 3 counties, Rock, Loup, and Blaine. We have had very little rain since middle of June, inch or less. Because of that one might think we should be shown as dryer than your map shows. However we have had pretty good growth in our warm season grasses so things still look good and I would say your map portrays things accurately.” - Rancher Source: visual scan VegDRI for July 16
If you rated the accuracy of the VegDRI image as a value LESS than 7 in the question above, how much worse or better are the vegetation/rangeland conditions in your state or region compared to the VegDRI image? ○ -5 ○-4 ○-3 ○ -2 ○ -1 ○ 0 ○ 1 ○ 2 ○3 ○ 4 ○ 5 Much worse /AMuch better Comments on areas (e.g., south central part of Buffalo county) that VegDRI did not accurately (e.g., VegDRI shows normal, but you observe severe) represent conditions. 4. What method did you use to compare the conditions with the image depicted on VegDRI? ○ Forage height ○ Forage coverage within specific area (i.e. hoop/square) ○ Visual scan/estimation ○ Other; specify:_________________ 5. What suggestions do you have for improving the website?
If you are interested in participating in the VegDRI Evaluation Group, please contact: Dr. Brian Wardlow bwardlow2@unl.edu or Nicole Wall nwall2@unl.edu