Download
1 / 18
180 likes | 208 Vues
Explore the Vegetation Drought Response Index (VegDRI) that merges climate and satellite data to map vegetation stress, facilitating real-time drought monitoring with high resolution. Learn about its tools, maps, and future developments.

E N D
The Vegetation Drought Response Index (VegDRI) An Update on Progress and Future Activities Brian Wardlow1, Jesslyn Brown2, Tsegaye Tadesse1, and Yingxin Gu2 1National Drought Mitigation Center (NDMC) 2USGS Center for EROS U.S. Drought Monitor Forum Portland, OR October 10-11, 2007
What is VegDRI? • VegDRI is a new drought index that combines • - climate-based drought index data • - satellite-based observations of vegetation conditions • - biophysical information (e.g., land cover type and soils) • to produce maps of drought-related vegetation stress that have • high spatial resolution (1-km2) and can be updated in near real-time (currently at a 2-week interval).
What is VegDRI? • VegDRI is a new drought index that combines • - climate-based drought index data • - satellite-based observations of vegetation conditions • - biophysical information (e.g., land cover type and soils) • to produce maps of drought-related vegetation stress that have • high spatial resolution (1-km2) and can be updated in near real-time (currently at a 2-week interval). Goal: A tool that has national-level monitoring capabilities and can provide local-scale drought information (i.e., county-level).
Satellite Data Climate Data Regression Tree Model (*) Biophysical Data 1-km2 VegDRI Map VegDRI Concept:Integration of Satellite, Climate, and Biophysical Data 1) Percent Annual Seasonal Greenness (PASG) 2) Start of Season Anomaly (SOSA) 1) self-calibrated Palmer Drought Severity Index (PDSI) 2) Standardized Precipitation Index (SPI) • 1) land use/land cover type • soil available water • capacity (STATSGO) • ecoregion type • irrigation status (*) Models developed from a 17-year historical record (1989 – 2005) of bi-weekly climate and satellite observations .
Expansion Schedule Operational in 2007 Spring 2008 Spring 2009 Expansion Schedule for Operational VegDRI Production
Operational VegDRI Product Development • Drought Monitoring viewer hosted by the USGS • Zoom and pan options • Overlay capabilities • Multiple layers of • information http://gisdata.usgs.net/website/Drought_Monitoring/viewer.php
Operational VegDRI Product Development 2. VegDRI webpage in Monitoring section of the NDMC website - debuted in May 2007 Goal: Provide ‘quick view’ maps and other graphical information. http://www.drought.unl.edu/vegdri/VegDRI_Main.htm
Regional State Sub-state VegDRI Quick-View Maps(multiple spatial scales)
VegDRI Quick-View Maps(land cover type) Complete Rangeland Cropland
VegDRI Area Statistics (% area)(currently available at state-level only) Wyoming – June 4, 2007 Entire state Rangeland Cropland
Change Maps • 3 Types: • Prior period • ex. - June 4, 2007 vs. May 21, 2007 • 2)Same period from the prior year • or a specific year in past • (* currently not available) • ex. – June 4, 2007 vs. June 4, 2006 • Historical average(* currently not available) • ex. – June 4, 2007 vs. average for June 4 (1989 through 2006)
Proposed VegDRI Products • Time-series animations • Trend line graphs – track VegDRI’s response across the year by major land cover type (e.g., cropland and rangeland) for a geographic area (e.g., county, watershed, or NRD) • Ranking or percentile maps for each period • - Produced when a historical time series of VegDRI maps • is produced from 1989 – present. • 4. Weekly updates of VegDRI maps
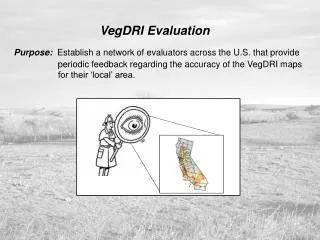
Evaluation of VegDRI A Multi-Source ‘Convergence of Evidence’ Approach • Feedback from 81 evaluators across the 15-state region. • Composition: • 19 climate experts (state climatologists & USDM authors) • 42 agricultural specialists and other experts (extension & gov’t agencies) • 20 agricultural producers • User workshops: 3 per year nationally • 2006: Illinois, Oklahoma, and New Mexico • 2007: North Dakota, Texas, and Wyoming • 2008: western U.S. (states TBD) • 2009: eastern U.S. (states TBD)
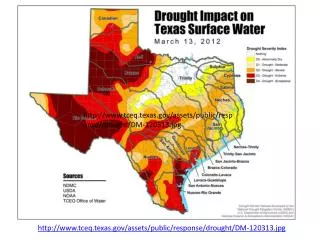
VegDRI – Sept. 24, 2007 USDM – Sept. 25, 2007 Evaluation of VegDRI A Multi-Source ‘Convergence of Evidence’ Approach • Feedback from 81 evaluators across the 15-state region. • Comparisons with other drought index maps (e.g., USDM).
Evaluation of VegDRI A Multi-Source ‘Convergence of Evidence’ Approach • Feedback from 81 evaluators across the 15-state region. • Comparisons with other drought index maps (e.g., USDM). • Comparisons with ground truth data. • USDA county crop yield data • Soil moisture data (state MESONETS) • Biophysical vegetation data (USDA ARS and LTERs) • - biomass, leaf area index, and net primary productivity
VegDRI Research Activities • Test additional variables in the VegDRI models: • -land surface temperature • - DEM products (elevation, slope, and aspect) • - higher resolution SSURGO soils data • - irrigated lands map – derived from remotely sensed data • Investigate the use of satellite-based VI observations from • instruments similar to the AVHRR (Advanced Very High • Resolution Radiometer): • - MODIS (Moderate Resolution Imaging Spectroradiometer) • - VIIRS (Visible/Infrared Imager/Radiometer Suite) • 3. Explore the development of a 250-m VegDRI using MODIS • data.
Additional Remote Sensing-Related Projects at the NDMC • Vegetation Outlook (VegOut) – provides 1-km2 outlook maps of future vegetation conditions (2-, 4-, and 6-week time steps) USGS EROS / NDMC Collaboration: • National-level irrigation mapping (250-m) • Normalized Difference Water Index (NDWI) (500-m) • ET estimation from land surface temperature data (1-km) CALMIT / NDMC Collaboration: • estimation of biophysical characteristics of vegetation (250-m) - LAI, green biomass, chlorophyll content, and FPAR • development for spectral/thermal-based indicators for drought monitoring (500-m)