Download
1 / 1
20 likes | 178 Vues
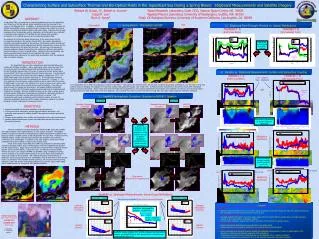
Characterizing Surface and Subsurface Thermal and Bio-Optical Fields in the Japan/East Sea During a Spring Bloom: Shipboard Measurements and Satellite Imagery. Richard W. Gould, Jr 1 , Robert A. Arnone 1 Craig M. Lee 2 Burt H. Jones 3.

E N D
Characterizing Surface and Subsurface Thermal and Bio-Optical Fields in the Japan/East Sea During a Spring Bloom: Shipboard Measurements and Satellite Imagery Richard W. Gould, Jr1, Robert A. Arnone1 Craig M. Lee2 Burt H. Jones3 1Naval Research Laboratory, Code 7333, Stennis Space Center, MS 39529 2Applied Physics Laboratory, University of Washington, Seattle, WA 98105 3Dept. Of Biological Sciences, University of Southern California, Los Angeles, CA 90089 ABSTRACT In May/June 1999, we conducted an intensive shipboard survey in the Japan/East Sea, focusing on the thermal and optical variability across the basin and in the region of the Subpolar Front. In addition, a shipboard satellite receiving system for AVHRR and SeaWiFS imagery provided synoptic coverage and enabled us to track features of interest and optimize stations and cruise tracks. Underway flow-through measurements of temperature, salinity, absorption, and attenuation were collected to describe surface features; CTD profiles and 3D Seasoar grids provided information on the vertical structure of the optical and physical fields. We examine the timing and spatial development of the spring bloom and the corresponding changes in the surface thermal field. We examine atmospheric correction and aerosol problems in the East Sea. We describe surface thermal and optical spatial patterns using shipboard and satellite measurements, and we link the surface expressions to the subsurface structure. We observed close agreement between shipboard-measured absorption and scattering coefficients and satellite-derived estimates, in terms of spatial pattern. Optical and thermal variability was clearly expressed along transects across meanders and eddies - sharp discontinuities were observed at the water mass boundaries in both the shipboard data and satellite imagery. SST 1.) Spring Bloom: Chlorophyll and SST Chlorophyll 3.) Shipboard Flow-Through: Physical vs. Optical Distributions TRANSECT A (E/W Cross-Basin) TRANSECT B (N/S Subpolar Front) March April March April Optical and thermal fields are tightly coupled Subpolar Front May June May June INTRODUCTION The Japan/East Sea is a semi-enclosed basin with restricted inflow and outflow and complex circulation. Warm, oligotrophic water enters the basin from the south through the Tsushima/Korea Strait and bifurcates into the Tsushima Current that flows eastward along the coast of Japan and the East Korean Warm Current (EKWC) that flows northward along the Korean Peninsula. A central branch through the central southern basin may also be present (Naganuma, 1977). The EKWC breaks away from the Korean coast near 37° N and meanders eastward, bisecting the basin and forming the Subpolar Front around 40° N (Figure 1). The front separates the cold, dense, weakly-stratified northern water from the warmer, stratified water to the south. The Subpolar Front is also a region of very active eddy formation and exhibits strong thermal and bio-optical gradients. Flow exits the basin through the Tsugaru and Soya Straits. By coupling AVHRR and SeaWiFS imagery we define the SST and bio-optical properties and begin to characterize and interpret the variability. Although SeaWiFS imagery can be used to derive surface optical properties (absorption, backscattering coefficients), additional validation of the atmospheric correction and bio-optical algorithms is required. CTD hydrosections and towed, undulating profiles (SeaSoar) enable us to link the subsurface distribution patterns with the surface expressions visible in the satellite imagery, to better understand the mixing processes. 4.) Satellite vs. Shipboard Measurements: Surface and Subsurface Coupling TRANSECT A (E/W Cross-Basin) TRANSECT B (N/S Subpolar Front) red– satellite blue- shipboard In the Japan/East Sea in 1999, the spring bloom started in late March – early April in the southern basin. By late April, the bloom progressed northward to cover the entire central and southern regions, including the Subpolar Front and even coastal areas along the Russian coast in the north. In May the bloom extended over the northern basin while chlorophyll values to the south decreased. Values north of the front remained high through May; by June, highest chlorophyll concentrations were localized in the Korean and Japanese coastal currents in the south with values north of the front declining. SST increased from south to north from March through May, with colder waters gradually retreating northward. SST Subpolar Front 2.) SeaWiFS Atmospheric Correction: Standard vs NIR/412 Iteration 5/21/99 5/29/99 Standard Atmospheric Correction NIR/412 Iteration Standard Atmospheric Correction NIR/412 Iteration OBJECTIVES • Examine the spatial and temporal variability of the spring bloom. • Collect ground truth reflectance, aerosol optical thickness, absorption, and scattering measurements to validate SeaWiFS atmospheric correction and optical algorithms. • Compare spatial patterns from satellite and shipboard flow-through measurements. • Examine relationships between surface and subsurface thermal and ocean color (bio-optical) features. Subsurface expression of surface features (Seasoar) Rrs(412) Rrs(412) SeaWiFS Rrs(412) and Rrs(670) are negative in clear water? Aerosol problem? Calibration problem? (blue pixels indicate negative Rrs) METHODS We have compiled a two-year climatology of daily AVHRR (SST) and SeaWiFS (bio-optics) imagery of the Japan/East Sea, at 1 km spatial resolution. The imagery provides a long-term data base to characterize the spatial and temporal variability of the region as well as a broader context to aid interpretation of cruise data. Products from the SeaWiFS imagery include chlorophyll concentration and absorption and scattering coefficients at six wavelengths. In addition to the daily imagery, weekly and monthly composites have been created to reduce cloud-covered pixels. Much of the spring cruise (May/June 1999) was dedicated to collecting highly-resolved undulating profiles using a towed SeaSoar instrument equipped with physical and bio-optical sensors. Upper-ocean velocities were measured with a shipboard acoustic Doppler current profiler (ADCP). During the cruise, we collected real-time satellite thermal and ocean color imagery (AVHRR and SeaWiFS) using a shipboard receiving system, enabling us to optimize station locations and cruise tracks and providing the large-scale context of the circulation. We collected along-track measurements of absorption (a) and scattering (b) at nine wavelengths using an AC9 meter in flow-through mode, for comparison with SeaWiFS-derived estimates. We measured remote sensing reflectance (Rrs) with an ASD Field Spectroradiometer and aerosol optical depth (AOD) with a sunphotometer for comparison with satellite estimates. Absorption Coefficient Rrs(670) Rrs(670) Strong correlation between satellite (AVHRR,SeaWiFS) and in situ measurements Cruise Track Bathymetry SeaWiFS Flow-Through SeaWiFS Flow-Through AOT(412) () AOT(412) () Ship station (Rrs and AOT measurement) Scattering Coefficient B A SeaWiFS vs. Shipboard Measurements: Aerosols and Reflectance 5/21/99 - AOT 5/29/99 - AOT blue linesfrom SeaWiFS,red linesfrom sunphotometer Standard Atmospheric Correction Standard Atmospheric Correction Summary Solid lines –shipboard Rrs Symbols – SeaWiFS Rrs Spring Bloom • Started in late March/early April in the southern basin, progressed northward through late May, and ended by early June. • SST increased from south to north during the same period. red– 5/21/99 blue– 529/99 SeaWiFS Atmospheric Correction ADCP Currents (5/21, 0945 – 5/25, 0500) overlaid on AVHRR SST (5/20, 2136) • Standard SeaWiFS atmospheric correction yields negative Rrs(412) and Rrs(670), possibly due to strongly absorbing aerosols in this region and/or a calibration problem. • A new iterative procedure adjusts the Rrs(412), and some of the Rrs(670), to positive values. circles- standard squares - iteration Optical/Physical Linkages • Optical and physical fields (temperature and salinity) are tightly linked. • Highest absorption and scattering coefficients are coincident with physical gradients. NIR/412 Iteration NIR/412 Iteration Satellite/Shipboard Comparisons and Surface/Subsurface Coupling 0 50 100 150 • Strong correlation was observed between satellite and shipboard measurements, in terms of spatial pattern (SST, absorption, scattering) and absolute magnitude (SST, absorption). • Temperature and salinity isolines inside filaments can be displaced 225 m relative to ambient. • A chlorophyll maximum was observed at 35 m in the seasonal thermocline along both transects. SeaWiFS aerosol models don’t match measured aerosol pectral shapes, yet SeaWiFS Rrs at blue wavelengths underestimate measured Rrs values ??? cm/sec