Download
1 / 26
260 likes | 283 Vues
This study explores the accessory purchase behaviors of new and pre-owned boat buyers, including seasonal buying patterns and the impact of accessories on dealer selection. It also examines spending trends and the categories of accessories purchased in 2011.

E N D
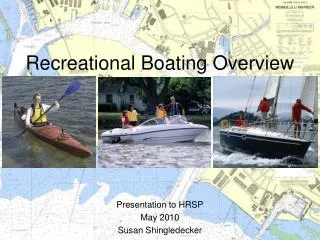
Walk Through the 2011 Recreational Boating Statistical Abstract Section 1 Boating Population • Participation Estimates • 2011 Participation Study Results • 2011 Boat Owner Study Results Section 2 Economic Factoids Section 3 Retail Market Section 4 Pre-owned Market
Walk Through the 2011 Recreational Boating Statistical Abstract Continued Section 5 Marine Expenditures Section 6 2010 U.S. Boat Registrations Section 7 Imports/Exports Sections 8 to 17 Outboard Engine and Boat Sales by Category Section 18 NEW Accessory Study Results
2011 Recreational Boating Statistical Abstract Accessory Market Study Webinar Presentation June 28, 2012
Study Objectives • This study is designed to investigate accessory purchase behaviors of new and pre-owned boat buyers both before and after boat delivery, including how consumers become aware of available accessories for their boats, and the role accessories play in choice of a dealer, broker or retailer. • Among all boat owners, including existing owners (more than 18 months of ownership) report all 2011 accessory purchases by category. • Document whether specific category purchases were add on, repair / replacements, or upgrades • Examine seasonal buying patterns for add on, repair or replacements and upgrade purchases • Document where purchases were made and who performed installation • Compare 2011 accessory spending to 2010, as well as anticipated 2012 spending
Study Methodology and Sampling • Source Data / Methodology Summary • Nationally representative sample of 3,000 boat owners • Surveys conducted November, 2011 • All respondents screened for sensitive occupations, boat decision maker and current recreational boat ownership • Survey conducted via Internet web panel research • Data weighted using NMMA-provided share data: 90% of all boats in operation are existing (bought > 18 mo), 8% are purchased used, 2% purchased new. • Respondents exposed to 20 categories of accessories with examples included for each category.
Boat Owner Statistics • Owner profile Summary • Age range 18 – 82. Average age was 41 for new buyers, 44 for pre-owned buyers and 55 for existing owners • Gender: 55% male for new buyers, 42% male for pre-owned buyers and 50% for existing owners • Household recreational boat ownership: 1.6 boats for new buyers, 1.5 for pre-owned buyers and 1.4 for existing owners • 88 brands of boats and 35 brands of motors represented • Ethnicity: 90% Caucasian, 3% African American, 3% Hispanic, 2% Asian, 2% Other • Other demographics recorded: Marital status, Education level, Employment status and Household income • State of residence: all 50 states represented
Purchased Boat From…Individual, Dealer, Broker Owners by Boat Type Total Owners
Accessories Before Boat Delivery Added Accessories before delivery Sources of Awareness of Accessories Available Purchased New Purchased Pre-owned
Accessories Influence Dealer or Retailer Choice How much did accessories influence your choice of the dealer, retailer or broker you purchased from (excludes purchased from individual) 36% 15% Accessories drive dealer selection
Timing of Initial Accessory Sales…First 6 Months Within the first 6 months after delivery did you purchase any new accessories for your boat? If so when? Purchased Pre-owned Purchased New First two months after delivery is prime time to market accessories
% of Owners Who Purchased Accessories in 2011 % of owners who purchased one or more categories of accessories for their boat in 2011 After 4 years of ownership accessory buying continues 3 out of 4 owners purchased accessories in 2011
Owner Spending on Accessories in 2011 Among those who purchased one or more accessory -- how much did you spend on accessories in 2011? (excluding installation and labor) New buyers are big spenders but don’t ignore Pre-owned buyers, or the existing owners (who represent the largest share of all owners)
What They Bought in 2011 Which of the following categories of accessories did you purchase for your boat in 2011? All owners (multi mention)
What They Bought in 2011 Which of the following categories of accessories did you purchase for your boat in 2011? By owners group (multi mention)
What They Bought in 2011 Which of the following categories of accessories did you purchase for your boat in 2011? All owners (multi mention) New buyers purchased an average of 4 categories, pre-owned 3.7 and existing owners 2.5 categories
Share of Spending …Add-ons, Repairs, Upgrades What percent of the amount spent in 2011 was for add on items, repair or replacement items and upgrades? Existing owner (19-48 mo.) Purchased New Purchased Pre-owned Add on items continue through ownership cycle while repair and replacement parts grow Existing owner (48+ mo.)
When Do Owners Buy? In general is there a particular time of the year you tend to make purchases that are:
Where Do They Buy Accessories? Where did you purchase these boat accessories in 2011? Dealers / boat shows get first opportunity among new boats only
Who Did The Installation? Who did the installation for any accessories you purchased? (multi mention) Purchased New Purchased Pre-owned Existing Owner As accessory purchases shift to outdoor stores and retailers installation shifts to owner – missed opportunity for marinas??
Satisfaction With Installation How satisfied were you overall with the installation performed by … Installed by dealer Installed by marina Installed by retailer
2011 Versus 2010 Spending Net percent of owners that spent more / less in 2011 A net of 1.1% reported spending more in 2011
Anticipated 2012 Spending Net percent of owners that expect to spend more / less in 2012 A net of 18.3% anticipate spending less in 2012 For some, need for repairs may not be anticipated??
Estimated Total Spending on Accessories in 2011 Mechanically propelled boat owners including those who did not purchase accessories in 2011 The total accessory market estimate for mechanically propelled boats is nearly $4B for replacement / upgrade parts and over $2B for upgrades. X 10.4 million = $3.98 billion boats (Replacement / upgrades) $2.21 Billion (Add on items)
Top Line Findings Summary • Boating accessories are an integral part of the boat ownership process, both before and after the purchase process. • Dealership / retailer selection is influenced by accessories available 2. During 2011, 75% of all boat owners purchased one or more accessories within the 20 categories. 3. Average spending (among those who did purchase) was $821. • Most popular accessories include: safety, boat maintenance & repair, engine maintenance & repair, anchoring & mooring and covers & tops. • Among new boat buyers, the selling dealership has a decided advantage over other accessory retailers. • Among pre-owned buyers and existing owners, outdoor stores, mass merchandisers, the internet and marine specialty stores are top accessory retailers. • Owners report accessory spending was about the same as 2010. 62% expect to spend the same or more in in 2012, 38% expect to spend less.
More Details Inside 2011 Statistical Abstract –now available Buying Behaviors: By ownership type, boat type, when purchased, gender and amount spent. Product Category Results: By ownership type, boat type, when purchased, gender and amount spent Product Category Results Cross Tabulation: When purchasing one category what other category purchases most often occur? 2011 Accessory Spending: By ownership type, boat type, when purchased, gender and amount spent Accessory buyer Demographics: By ownership type, boat type, when purchased, and amount spent