Information Diffusion: Impacts, Challenges, and Insights
Discover the dynamics of information diffusion on networks like Twitter, addressing cascade growth, contagion processes, and the implications of large-scale data studies. Explore models like threshold and epidemic, the role of network topology, and seeding strategies for large outbreaks. Gain insights into characterizing cascades, influence maximization, and the significance of network positions when triggering outbreaks. Uncover the research questions and contributions in epidemic spreading on real networks, along with the dynamics of homogeneous mixing models in the spread of contagions.

Information Diffusion: Impacts, Challenges, and Insights
E N D
Presentation Transcript
Information Diffusion Kristina Lerman University of Southern California CS 599: Social Media Analysis University of Southern California
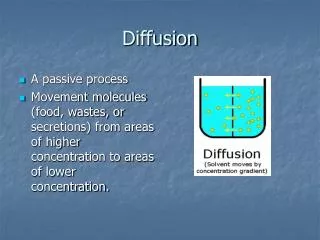
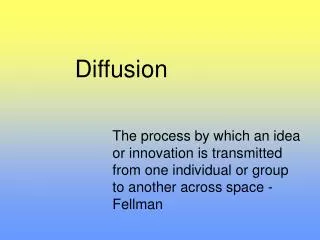
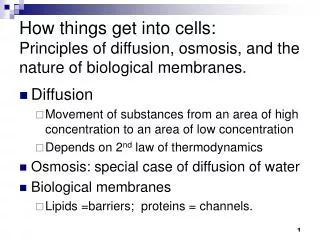
Diffusion on networks • The spread of disease, ideas, behaviors, … on a network can be described as a contagion process where an active node (infected/informed/adopted) activates its non-activeneighbors with some probability • … creates a cascade on a network • How large do cascades become? • What determines their growth?
Gangnam style • "Gangnam Style" became the first YouTube video to reach one billion views • As of May 31, 2014, the music video has been viewed over two billion times almost 13,000 man-years!
Studying diffusion: data • Large-scale data about contagion processes is now available • YouTube views [Crane & Sornette 2008] • Flickr favorites [Cha, Mislove & Gummadi, 2009] • Twitter retweets [Ghosh & Lerman, 2011] • Facebook likes [Dow, Adamic & Frigerri, 2014] • Challenges • Volume of the data • Storing and processing data • Complexity • How does the “whole” depend on its “parts” • Networks add to complexity
Studying diffusion: methods • Analytic models • Model cascading behavior, e.g., differential equation • Solve model under different conditions • Simulations • Implement a model to synthetically recreate the process • Empirical studies • Does observations of real-world data agree with model and simulations results?
Cascading Behavior in Complex Socio-technical Networks (Borge-Holthoefer et al.) • Research questions • How can global cascades occur on sparse networks? • What affects cascade growth? • Network topology • How node is activated by an active neighbor • Properties of the diffusing item? • How can cascades be characterized? • Models of diffusion on networks • Threshold model • Epidemic models • Complex contagion • Empirical data allow testing of models
Threshold model (Watts 2002) • Each node has some “infection threshold” fi • Node becomes infected if fraction of infected neighbors is more than threshold Exposure response function f3 f4 f1 1 f2 infected infection prob. exposed r fiki number infected neighbors
Threshold model (Watts 2002) • Under some conditions, global cascades can start from a few “infected” seeds • Network topology and individual thresholds interact in cascading behavior
Epidemic models • Infected nodes propagate contagion to susceptible neighbors with probability m (transmissibility or virality of contagion) Exposure response function 1 infected infection prob. exposed number infected neighbors
Epidemic models • Epidemic threshold t: • For m < t, localized cascades (epidemic dies out) • For m> t, global cascades • Epidemic threshold depends on topology only: largest eigenvalue of adjacency matrix of the network • True for any network N Num. infected nodes Epidemic threshold 0 Transmissibility, m
Complex contagion • Virus can propagate with a single exposure. Spread of behaviors requires multiple exposures. • Non-monotonic exposure response Exposure response function 1 infected infection prob. exposed number infected neighbors
Characterizing cascades • Connected tree-like subgraph. Typically star-like • Size related to centrality
Seeding large outbreaks • How to select seeds that will initiate large outbreaks? • Influence maximization • Are some network positions better at triggering large outbreaks? • Being a hub is sufficient but not necessary • “Million follower fallacy” (Cha et al) • “hub fire wall” – epidemics die out when reaching a hub
Epidemic Spreading on Real Networks: An Eigenvalue Viewpoint [Wang et al, 2003] • Research questions • How do epidemic cascades on a real network? • Does an epidemic threshold exist for a given network? • Contributions • Model how epidemics propagate on a network • Propagation depends on network topology • epidemic threshold is related to the largest eigenvalue of the adjacency graph describing the network
Homogeneous mixing model • Homogeneous mixing • Each node interacts with every other node • Infection rate m: a node infects neighbor with probability m • Curing rate d: infected node is cured with probability d infected exposed cured
Homogeneous mixing model • Homogeneous mixing • Each node interacts with every other node • Infection rate m: a node infects neighbor with probability m • Curing rate d: infected node is cured with probability d infected exposed cured
Homogeneous mixing model • Homogeneous mixing • Each node interacts with every other node • Infection rate m: a node infects neighbor with probability m • Curing rate d: infected node is cured with probability d infected exposed cured
Homogeneous mixing model • Homogeneous mixing • Each node interacts with every other node • Infection rate m: a node infects neighbor with probability m • Curing rate d: infected node is cured with probability d infected exposed cured
Homogeneous mixing: epidemic threshold • Infection rate m: node infects neighbor with probability m • Curing rate d: node is cured with probability d • Number of infected nodes: Ninf=(1-d/m<k>)N • Epidemic threshold: critical value of m/d = t =1/<k> • beyond which Ninf N, but below Ninf 0 infected exposed cured
Epidemics on networks • Homogeneous mixing model is a good approximation of virus propagation in a population where contact among individuals is homogeneous, i.e., each individual is equally likely to encounter another • Public spaces: airports, shopping centers, … • Schools • Public transportation • But, social interactions are usually structured • what role does network structure play in epidemic spread? • How does the size of cascades depend on network properties?
Simulations on real and synthetic graphs • Simulate epidemics on • Real-world networks • Scale-free graphs (power law degree distribution) • Random graphs (Poisson degree distribution) • Results are the same as homogeneous mixing model • Simulations steps • Start with a set of randomly chosen infected nodes • At each time step • Infected node attempts to infect each neighbor (probability m) • An infected node is cured (probability d) • Continue until number of infected nodes no longer changes
Simulation results on real-world network • Simulations on 10,900 node Oregon network graph, with <k>=5.72, m=0.14 Cascade size vs time m/d=1.75 m/d=0.58
Epidemic threshold and cascade growth m/d=0.4 m/d=0.2 m/d=0.13 m/d=0.06 m/d=0.1
Epidemic threshold and cascade size N Num. infected nodes Epidemic threshold 0 Effective Transmissibility, m/d
Summary • A variety of models proposed to explain cascading behavior on networks • Some models explain the relationship between properties of the network and properties of cascades, e.g., epidemic threshold depends on the eigenvalue of the adjacency matrix of the graph • Some models can produce global cascades • What does data say?
The Structure of Online Diffusion Networks SHARAD GOEL, Yahoo! Research DUNCAN J. WATTS, Yahoo! Research DANIEL G. GOLDSTEIN, Yahoo! Research
“A relatively small number of seeds can trigger a relatively large number of adoptions via some, usually multistep, diffusion process”
How often How much Is it worth it
Findings Most cascades small and shallow Most adoptions lie in such cascades. Rare for adoptions to result from chains of referrals
Yahoo! Kindness one month period in 2010, Yahoo!’s philanthropic arm launched a website (kindness.yahoo.com) 59,000 users adopted the campaign 1 7 Different Sources
Zync a plug-in for Yahoo! Messenger, an instant messaging (IM) application, that allows pairs of users to watch videos synchronously while sending instant messages to one another. 2 7 Different Sources
The Secretary Game Players are encouraged to share the game’s URL with at least three other people with an explanation that the game designers are seeking the world’s best players. 3 7 Different Sources
Twitter News Stories. 80,000 news stories posted on the Twitter during November 2011, where the original article was distributed by one of five popular news sites: The New York Times, CNN, MSNBC, Yahoo! News, and The Huffington Post. Tweeted Adopted 4 7 Different Sources
Twitter Videos 540,000 YouTube videos posted on Twitter during November 2011 Tweeted Adopted 5 7 Different Sources
Friend Sense third-party Facebook application that queried respondents about their political views as well as their beliefs about their friends’ political views 6 7 Different Sources
Yahoo! Voice paid service launched in 2004 that allows users to make voice- over-IP calls to phones through Yahoo! Messenger. 1.8 million users purchased voice credits, who are defined as adopters 7 7 Different Sources
Data SourcesVaried Cost Nature of the network Incentive Timescale
“The usual intuition regarding heavy-tailed distributions, however, is that large events, although rare, are sufficiently large to dominate certain key propertiesof the corresponding system.”