Download
1 / 12
120 likes | 209 Vues
Streamlining data sharing for PM emissions analysis, forecasting, and communication. Access tools for research and decision-making. Enhance integration and fill data gaps. Efficiently present information to stakeholders.

E N D
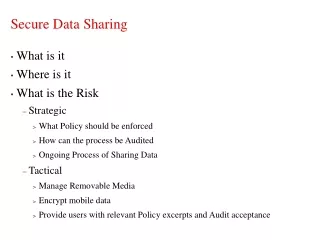
RPO Data Sharing Management of visibility and PM emissions/concentrations requires coordination among local, state, and federal agencies in the collection of data, in the analysis of these data, in forecasting emissions, air pollutants and their impacts, and in the communication of information to managers and the public. An integrated PM Network will offer straightforward access to existing and new data and tools for research, assessments and decision-making. The information resources resulting from the proposed project would help the community identify and fill myriad data gaps, facilitate estimation methods for emissions and air quality impacts, provide means for comparing emissions methods, incorporate newly available data such as satellite imagery, and present information clearly and effectively to managers and the public.
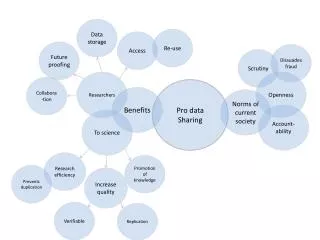
Federated Information System VIEWS RPO RPO NASA NAAPS • Data producers maintain their own workspace and resources (data, reports, comments). • However, part of the resources are shared through a Federated Information System. • Web-based integration of the shared resources can be across several dimensions: Spatial scale: Local – global data sharing Data content: Combination of data generated internally and externally MANE-VU Private Shared WRAP CEN-RAP Other Federations Federated Information System Data, Knowledge Tools, Methods VISTAS Midwest RPO • The main benefits of sharing are data re-use, data complementing and synergy. • The goal of the system is to have the benefits of sharing outweigh the costs.
Distributed Voyager (dVoy) Voyager software allows web-browsing of distributed multidimensional data sets. The browser has three major components: data access, navigation and display which interact following the model-view-controller (MVC) paradigm. The data access (model) component offers a homogeneous, read-only access mechanism to a collection of heterogeneous, autonomous and distributed information sources. The Voyager data access uses a global multidimensional schema consisting of spatial, temporal, parameter and other dimensions common to environmental data. In other words, viewed through the eyes of Voyager, all data occupy a range in the XYZT physical data space.
Wrappers & Mediators The federated data access infrastructure incorporates the concepts of wrappers and mediators. The main data access software components of Voyager are wrappers, which encapsulate the data sources and remove technical heterogeneity, and mediators, which resolve the logical heterogeneity. In order to find, share and fuse geo-environmental data requires that data be coded in 4D physical data space. Much of the ‘wrapping’ effort consists of providing appropriate metadata for geo-spatio-temporal coding of heterogeneous, uncoded data on the web. In Voyager, all data are modeled as points (data granules) in a multidimensional data space. The navigation (controller) consists of querying and displaying selected slices through the data cube, e.g., a spatial slice (for a specific time) yields a map, while a time slice (for a given location) produces a time series. Controllers attached to each dimension facilitate navigation to any granule in the data cube within a few clicks.
Web Services Data/Tools Providers Data/Tools Users Web Services Integrated Maps, Tables, Charts Catalog Services Relational Databases Chaining Services Processing & Modeling GIS Layers Access Services Processing Services Analysis & Assessment Internet Text and Images Web services, emerging technologies that allow for automated data integration and enriched interfaces for information exploring and processing, offer capabilities for improving the exchange of data across the web. A web service is a self-contained and self-described application, utility, or other service available over the Internet using standardized eXtensible Markup Language (XML) for communication with other computers and applications. Web services provide the middleware in information networks that link distributed heterogeneous data and tools with their users.
dVoy Infrastructure Applications PM Policy Regulation Mitigation Data Use • Wrappers (middleware that translates heterogeneous data) provides access to data through a uniform front-end. • The retrieval of specific data ‘slices’ required by viewing and processing services is controlled by the user. The user also decides which wrapped datasets to browse and how to stack and display the layers. • Because of the flexibility and adaptability in a user-driven infrastructure, we expect the proposed infrastructure to support decision-making for a variety of policy, regulatory, and mitigation needs.
Current State of dVoy The initial Voyager infrastructure browser is being developed at CAPITA with support from NSF, EPA, NOAA, MARAMA and others. Given the open, web services-based architecture, further web service components for data access, processing and viewing are anticipated from the community of developers and users. A dozen relevant heterogeneous web-based aerosol data were identified, endowed with web service wrappers and are being delivered for web browsing through Voyager. These include: ASTR global fire location data from the European Space Agency, smoke aerosol pattern from SEAWIFS satellite data, aerosol chemical composition from the IMPROVE network, and the ASOS automated surface visibility monitoring data. Many additional datasets are anticipated from the user community, including the large number of OGC-compliant data layers, which are directly usable by Voyager. The development of data and interface standards have made distributed data networks feasible. A number of networks are being planned based on these standards, allowing the RPO network to interact with them. Examples include the OGC network, ESRI geography network, NASA SEEDS network, NSF Digital Government network, and EPA’s National Environmental Information Exchange Network.
Multi-source data integration Spatial integration of four data layers that together determine that the smoke plume is elevated and does not impact the surface.
Quebec Smoke Plumes – July 2002 Linking time, map, and webcam rendering services would provide spatial, temporal and visual displays for tracking, analyzing, and presenting information
Integration of surface and satellite data SeaWiFS Reflectance, PM2.5 in Idaho (Aug 2000) Derived Aerosol Optical Depth, Fire Locations in Idaho (Aug 2000)
Multi-view Rendering Linking time, map, and webcam rendering services would provide spatial, temporal and visual displays for tracking, analyzing, and presenting information
RPO PM Watch System Virtual PM Monitoring Dashboard This is a web-page for one-stop access to pre-set views of current PM monitoring data including surface PM monitoring, satellite monitoring, weather and forecast models. It taps into the on-line data services of EPA and RPOs, NASA, and NOAA and provides a comprehensive picture of the current and recent multidimensional aerosol pattern. The new technologies for the real time aerosol dashboard will include the creation of group viewing and annotation layers. The dashboard will be crafted from the components in Voyager web services. Virtual Workgroup Website This is an interactive website which facilitates the active participation of diverse members in the interpretation and discussion of the on-line PM monitoring data. Virtual workgroup members can identify and contribute information sources relevant to the current events (e.g. special data, web cam images, news reports), contribute insights on data quality and interpretation and prepare summary reports on aerosol events during the events. Air Quality Managers Console The console helps PM managers make decisions during major aerosol events. The console delivers a subset of the PM data relevant to the AQ managers, which includes the event summary reports prepared by the Virtual workgroups. The console manages the ‘watch’ assignments of human observers on the Virtual PM Monitoring Console and issues alerts to AQ managers and other interested parties.