Download
1 / 20
240 likes | 679 Vues
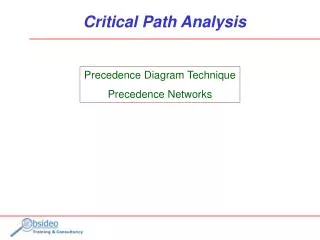
Critical Path Analysis. Precedence Diagram Technique Precedence Networks. Critical Path Analysis. why do it? what are the inputs? the process using the outputs PERT and uncertainty. the context. identify tasks sequence estimate resources analysis scheduling optimisation.

E N D
Critical Path Analysis Precedence Diagram Technique Precedence Networks
Critical Path Analysis • why do it? • what are the inputs? • the process • using the outputs • PERT and uncertainty
the context • identify tasks • sequence • estimate • resources • analysis • scheduling • optimisation
what are the benefits? • critical path • non-critical activities
what are the inputs? • tasks • sequence/dependencies • durations
Sequence the most common sequences / dependencies Task B depends upon Task A; B cannot start until A is finished Task A Task B Task B Tasks B and C depend on Task A; neither can start until A is finished, but B and C are independent of each other Task A Task C Task A Task C depends upon Task A and B; C cannot start until both A and B are finished Task C Task B
early finish time early start time duration task number and/or name late finish time late start time float rules and conventions • just one start • just one finish • no danglers slack
Task 02 Task 03 Task 07 Task 01 Task 04 Task 05 Task 09 Task 06 Task 08 the process - 2 stages draw analyse
3 4 7 10 7 3 Task 02 Task 03 5 17 12 Task 07 12 1 3 6 9 3 17 0 3 3 18 9 Task 01 Task 04 Task 05 Task 09 2 7 5 Task 06 Task 08 the process - forward pass Duration = 18 5 2 3
3 4 7 10 7 3 Task 02 Task 03 12 9 2 2 9 5 5 17 12 Task 07 12 1 3 6 9 3 17 0 3 3 18 9 0 12 17 Task 01 Task 04 Task 05 Task 09 3 12 18 0 17 3 9 0 0 0 9 0 2 7 5 Task 06 Task 08 15 10 17 the process - backward pass 5 2 3 10 13 15
more unusual links and relationships so far all links have been finish-start links... 3 days Task B depends upon Task A, but with a 3 day delay; B cannot start until 3 days after A is finished Task A Task B Task A The start of Task C depends on the start of Task A; this is a start-to-start link; it may also incorporate a delay Task C Task A The finish of Task C depends upon the finish of Task A Task C
using the outputs • Gantt Charts • resource histograms • resource smoothing • optimising the schedule
Scheduling task res. Duration Calendar task 1 task 2 task 3 task 4 task 5 task 6 task 7 2 days 3 days 1 day 2 days 7 days 4 days 1 day Jane Bill Jane Jim Bill Jane Bill
Task 02 Task 01 Task 04 Task 03 PERT and uncertainty - 1 The critical path looks like tasks 01-02-04 5 2 4 4 But what if you are not sure about the duration for Task 03?
Task 02 Task 01 Task 04 Task 03 PERT and uncertainty - 2 The better estimate for Task 03 might be its PERT estimate, or Expected Value, EV) 5 2 4 EV = O + 4L + P ___________ 6 O = Optimistic estimate (say 2) L = Most Likely (say 4) P = Pessimistic (say 12) 4 In this example the EV = 6, which does, in fact change the critical path
PERT and uncertainty - 3 But how confident can we be in these results? An duration’s spread is the degree to which estimates of the duration differ from each other. If every estimate of duration were about equal, the estimate would have very little spread. There are many measures of spread. The distributions on this page have the same mean but differ in spread: the distribution on the bottom is more spread out.
PERT and uncertainty - 4 Standard deviation is used as a measure of spread. In a normal distribution, about 68% of estimates are within one standard deviation of the mean and about 95% of the estimates are within two standards deviations of the mean. EV = O + 4L + P ___________ 6 O = Optimistic estimate (say 2) L = Most Likely (say 4) P = Pessimistic (say 12) SD = (P – O)/6 In our example SD = (12-2)/6 = 1.666 So, we could say that, for task 03: With 68% certainty, the duration will be between 2.34 and 5.66 (4 ± SD) With 95% certainty the duration will be between 0.68 and 7.32 (4 ± 2SD)
Task 06 Classroom Practice - 1 4 2 Task 02 Task 03 3 Task 07 9 4 5 2 Task 04 Task 05 Task 09 Task 01 4 1 Task 08
Classroom Practice - 2 4 2 Task 02 Task 03 5 Task 05 6 2 5 Task 01 Task 04 Task 07 4 Task 06
Task 06 Classroom Practice - 3 2 2 Task 02 Task 03 3 Task 07 7 5 2 Task 01 Task 05 Task 09 4 + 4 days