CE 552
CE 552. - Typical crash rates and distributions - Crashes that take the highest toll on human life. Rates …why?. To compare locations To decide if a location is at abnormal risk Rate per million entering vehicles:. In-class calculation. In-class calculation.

CE 552
E N D
Presentation Transcript
CE 552 - Typical crash rates and distributions - Crashes that take the highest toll on human life
Rates …why? • To compare locations • To decide if a location is at abnormal risk • Rate per million entering vehicles: In-class calculation
In-class calculation This should really be RHMVM, shouldn’t it?
Expected value analysis • Use only to compare “similar” sites (geometry, control, volume) • Problem: crashes are non-neg. count data (normal distribution does not apply) In-class calculation
Cluster analysis • E.g., if a site has one right-angle, two rear-end and 6 left-turn crashes, one might say the left-turn crashes represent a cluster • But … what if the # of left turns is very high … then, is 6 high? • Need exposure data • Must usually use good engineering judgment
High Crash Location Methods • Frequency • Rate • Severity/Cost • Some combination • Iowa DOT uses .2F+.2R+.6C • Critical Rate Factor method • Empirical Bayes
Critical Crash Rate Factor method Error: this should say Z, not S For derivation of equation and interpretation of terms, see link
Summarizing crash data Type Severity, e.g., KABCO, MAIS • Time Periods • Hour • Day • Month Contributing Circumstances Environmental Conditions a) light condition b) surface condition
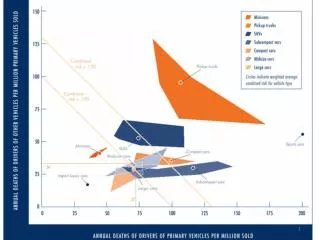
Typical crash rates Iowa data for risk by road type Oregon crash rates (compare to Iowa) Source: NCHRP Web Only Document 126 Guidelines for using NC crash rates Crash rate discussion
European crash rates by road type Low traffic flow roads – there are significant differences in fatal and serious accident rate between roads with less than 10,000 Average Annual Daily Traffic (AADT), roads with 10,000 to 20,000 AADT, and roads with more than 20,000 AADT. (The ratio of these differences is about 2.3:1.8:1); Note: to convert /bvkm to /HMVM, multiply by ~6 (Iowa K+A+B crash rate per HMVM in ~60, much lower than the numbers presented above for Europe if you multiply them by 6) http://www.eurorap.org/library/pdfs/roaddesignfactors.pdf
Kentucky Intersection Crash Rates http://www.ktc.uky.edu/Reports/KTC_03_21_SPR258_03_2I.pdf
From Oregon Study … http://www.oregon.gov/ODOT/HWY/TRAFFIC-ROADWAY/docs/pdf/safety_of_4-leg_vs_T.pdf
http://www.oregon.gov/ODOT/HWY/TRAFFIC-ROADWAY/docs/pdf/safety_of_4-leg_vs_T.pdfhttp://www.oregon.gov/ODOT/HWY/TRAFFIC-ROADWAY/docs/pdf/safety_of_4-leg_vs_T.pdf
http://www.oregon.gov/ODOT/HWY/TRAFFIC-ROADWAY/docs/pdf/safety_of_4-leg_vs_T.pdfhttp://www.oregon.gov/ODOT/HWY/TRAFFIC-ROADWAY/docs/pdf/safety_of_4-leg_vs_T.pdf
http://www.oregon.gov/ODOT/HWY/TRAFFIC-ROADWAY/docs/pdf/safety_of_4-leg_vs_T.pdfhttp://www.oregon.gov/ODOT/HWY/TRAFFIC-ROADWAY/docs/pdf/safety_of_4-leg_vs_T.pdf
Crashes that take the highest toll on human life • Head-ons, Intersections, ROR, VRU • Show iRAP video http://www.eurorap.org/library/pdfs/roaddesignfactors.pdf
Head-on collisions • head-on crash. • Fatal Head On Accident Six Killed On US12 Near Morton WA • Truck crossing median – 7 fatals video http://onlinepubs.trb.org/onlinepubs/nchrp/nchrp_rpt_500v20.pdf
Intersections (junctions) See: UMN captured crashes http://onlinepubs.trb.org/Onlinepubs/nchrp/nchrp_rpt_500v5.pdf
Run-off the road (ROR) http://www.t2.unh.edu/nltapa/Pubs/fhwa's_roadway_departure_program.pdf http://www.t2.unh.edu/nltapa/Pubs/PLD-1.pdf
http://onlinepubs.trb.org/Onlinepubs/nchrp/nchrp_rpt_500v6.pdfhttp://onlinepubs.trb.org/Onlinepubs/nchrp/nchrp_rpt_500v6.pdf http://www.t2.unh.edu/nltapa/Pubs/fhwa's_roadway_departure_program.pdf
Vulnerable Road users Motorcycles, bikes, pedestrians • Bicyclists and Other Cyclists (DOT-HS-810-986) • http://onlinepubs.trb.org/Onlinepubs/nchrp/nchrp_rpt_500v10.pdf • http://onlinepubs.trb.org/onlinepubs/nchrp/nchrp_rpt_500v22.pdf