Exploring STEM Careers
Exploring STEM Careers. Richard Therrien, NHPS Science Supervisor Richard.therrien@new-haven.k12.ct.us www.newhavenscience.org /STEM What is STEM? Why STEM careers? JOB outlook? Example Careers (videos) What motivates students? What do they need? What can parents do?.

Exploring STEM Careers
E N D
Presentation Transcript
Exploring STEM Careers • Richard Therrien, NHPS Science Supervisor Richard.therrien@new-haven.k12.ct.us • www.newhavenscience.org/STEM • What is STEM? • Why STEM careers? • JOB outlook? • Example Careers (videos) • What motivates students? • What do they need? • What can parents do?
WHY?Answer on paper, draw a scientist! Richard Therrien Richard.therrien@new-haven.k12.ct.us www.newhavenscience.org
What is STEM? • STEM education grows out of the idea that the boundaries between science, technology, engineering, and math are permeable. • Moreover, it asserts that its four disciplines are interdependent. • By endeavoring to blend science, technology, engineering, and math in its approach, STEM education seeks to create 21st century learning opportunities and skill development for all students.
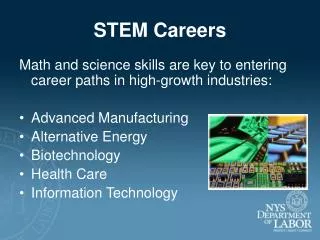
WHY SCIENCE (STEM)? • 75 % of jobs will be in STEM, science, technology, engineering, mathematics • Not just STEM careers, it is STEM in every job • Technology as a “global knowledge economy” is the future, and it requires different skills. • Business and industry want employees with these skills! • NHPS has shown success, with the community, with partnerships and dedicated educators… we need to continue at all levels, for all students! • For more see: www.newhavenscience.org/STEM, www.ctstemjobs.org
NHPS District STEM TIER II GOAL NHPS students will have quality coordinated STEM education and programs, giving them the needed interest and skills for the opportunity to succeed in higher education and have access to STEM careers. Adults will integrate and coordinate of STEM activities, programs, and curriculum and align to 21st Century skills, district goals and procedures. This will result in more students succeeding in STEM courses in middle, high school and college, and more students selecting STEM majors and careers
National STEM Crisis • U.S. behind in student indicators. • Foreign nationals ahead in jobs and degrees. • Urban students are falling behind. • Many plans exist to address this. • New national STEM Initiative addresses programs and teachers.
Skill Level Changes Skilled 20% Unskilled 15% Unskilled 60% Professional 20% Skilled 65% Professional 20% 1950 Today National Summit on 21st Century Skills for 21st Century Jobs
STEM Pipeline from 9th Grade to Bachelor’s Degree for Low-Income Students in the U.S. 10,000 Students in the Bottom Income Quartile Start the 9th Grade 6,600 of 10,000 Students Earn a High School Diploma (8,200 total) 3,860 of 10,000 Students Go to College 76 are Declared STEM Majors vs 800 total 710 of 10,000 Students Earn a Bachelor’s Degree 30 BA/BS in STEM Fields vs 400
Prepare students for the requirements of the 21 century economy Non-routine interactive How the demand for skills has changed Economy-wide measures of routine and non-routine task input (US) Mean task input as percentiles of the 1960 task distribution Non-routine analytic The kind of things that are easy to test and teach are disappearing fastest Routine manual Routine cognitive Non-routine manual
https://www.census.gov/dataviz/visualizations/stem/stem-html/https://www.census.gov/dataviz/visualizations/stem/stem-html/
Why 21st Century Skills? A Shifting Job Market 20th Century 21st Century 1 – 2 Jobs 10 – 15 Jobs Number of Jobs: Mastery of One Field Critical Thinking Across Disciplines Job Requirement: Subject Matter Mastery Integration of 21st Century Skills into Subject Matter Mastery Teaching Model: Subject Matter Mastery Integration of 21st Century Skills into Subject Matter Mastery Assessment Model: Courtesy of Linda Froschauer
THE EMERGING HIGHER EDUCATION ECOSYSTEM Community College 4-yr. applied baccalaureates The Workplace Post- Graduate Education? High School Community College Bachelor Students Acquiring Specific Skills - Dual Enrollments - Teacher Education 4-Year Institution NEW DIMENSIONS/OPPORTUNITIES ?? ?? ?? ?? ?? Online Courses/ MOOCs ??
Fewer than 40% of students who enter college intending to major in a STEM field complete a STEM degree. Increasing retention of STEM majors from 40% to 50% would generate three-quarters of the 1 million additional STEM degrees over the next decade. Many students who abandon STEM majors perform well in their introductory courses and would make valuable additions to the STEM workforce. 2012
CT Careers in STEM • 75% of CT jobs require STEM • Healthcare • Aerospace, • Computers • BioScience, • Financial, • Maritime, • Manufacturing
CT STEM Middle skill jobs are STEM (between high school and 4 year college education) • All top 10 2 year degrees are STEM • Most are in healthcare/manufacturing.
Manufacturing in Connecticut • Manufacturing Establishments in Connecticut = 4,937 • Manufacturing Employment =171,800 • Average Annual Compensation= $89,238 (26% higher than other sectors) • Connecticut Manufacturing Output = $28.9 billion, 13.4% of regional economy
New Haven Area • CT Dept of Labor stats for NH: • Health/BioScience Careers (all levels) (technicians, medical, research, labs, practioners, etc....) • Green Technologies & Manufacturing (all levels, high tech skills) • are where the jobs are!
People with lower levels of education in STEM make more than people with higher levels of education in non-STEM. 63 percent of Associate’s degrees in STEM earn more than Bachelor’s degrees in non-STEM occupations. 65 percent of Bachelor’s degrees in STEM earn more than Master’s degrees in non-STEM occupations. 47 percent of Bachelor’s degrees in STEM occupations earn more than PhDs in non-STEM occupations. Certificate holders in engineering earn more than Associate’s degree- holders in business and more than Bachelor’s degree-holders in education.
STEM CAREERS www.newhavenscience.org/STEM Guide to STEM Careers/Education for New Haven Link to STEM Programs In New Haven, Yale Community Science Parent Guide to Preparation for STEM, (Espanol) Link to CT STEM JOBS WebsiteInteratctive STEM Career Pathways Tool) STEM at CT Community CollegesSTEM Programs at CT Community Colleges/State UniversitiesSTEM Programs by CollegeSTEM Career Descriptions!Green Programs at CT Community CollegesGet Into Energy, Career Pathways in Energy Careers!Profiles of Different Types of Energy Careers:Training Programs for Energy Careers:Scholarships for Energy CareersWomen's Guide to Sustainable CareersArchitecture, Construction, Engineering Mentoring Program (ACE)High School Pathways to a Health Care CareerHealth Careers Exploration ProgramHealth Careers in ConnecticutIs a Health Careeer for ME?Preparing for a Health CareerCT Health JobsHealth Care Jobs at CT Community CollegesSummer Medical CampsYouth Health Services CorpsGuide to Preparation for STEM JobsJob Journey PostersJob Journeys in STEM PosterJob Journeys in Health PosterrConnecticut Career Paths 2012STEM Occupation Profiles from CT Dept of LaborCT Career ConnectionProgram Search by Occupation Cluster (Health, STEM, etc..)Wages Outlook for Occupations from CT Dept of LaborConnecticut Middle Skill JobsCurrent CT Labor Market InformationGuide for Students to Prepare for Manufacturing Careers in CT! (Connecticut. Dream it! Do It!Dream It! Do It! Career ProfilesDream It! Do It! Career Videos!Dream It! Do It! Career CalculatorNext Generation Manufacturing! Getting Started in CT STEM CAREER PATHWAYS at CBIA, With Video Profiles:
Science • Architectural Drafters (Annual Salary: $56,297) Atmospheric and Space Scientists(Annual Salary: $76,234) • Biofuels/Biodiesel Technology and Product Development Managers(Annual Salary: $118,081) • Biological Technicians(Annual Salary: $47,075) • Bioinformatics Technicians(Annual Salary: $42,364) • Brownfield Redevelopment Specialists and Site Managers(Annual Salary: $94,605) • Chemical Equipment Operators and Tenders(Annual Salary: $42,691) • Chemical Technicians(Annual Salary: $45,384) • Crop and Livestock Managers(Annual Salary: $73,334) • Environmental Restoration Planners(Annual Salary: $66,817) • Environmental Science and Protection Technicians, Including Health(Annual Salary: $42,999) • First-Line Supervisors/Managers of Agricultural Crop and Horticultural Workers(Annual Salary: $44,499) • First-Line Supervisors/Managers of Animal Husbandry and Animal Care Workers(Annual Salary: $44,499) • First-Line Supervisors/Managers of Aquacultural Workers(Annual Salary: $44,499) • Fish and Game Wardens(Annual Salary: $48,817) • Food Science Technicians(Annual Salary: $48,839) • Forest and Conservation Workers(Annual Salary: $45,420) • Geodetic Surveyors(Annual Salary: $56,584) • Natural Sciences Managers(Annual Salary: $117,444) • Physicists(Annual Salary: $110,968) • Soil and Water Conservationists(Annual Salary: $71,760) • Wind Turbine Service Technicians(Annual Salary: $49,283) • Zoologists and Wildlife Biologists(Annual Salary: $69,202)Technology • Computer and Information Scientists, Research(Annual Salary: $118,989) • Computer and Information Systems Managers(Annual Salary: $117,757) • Computer Science Teachers, Postsecondary (Salary Unavailable) • Database Administrators(Annual Salary: $71,929) • Graphic Designers(Annual Salary: $54,526) • Network Systems and Data Communications Analysts(Annual Salary: $77,539) • Security Management Specialists(Annual Salary: $72,626) Engineering • Aerospace Engineering and Operations Technicians(Annual Salary: $58,939)Aircraft Mechanics and Service Technicians(Annual Salary: $55,910) • Automotive Engineering Technicians(Annual Salary: $49,368) • Automotive Master Mechanics(Annual Salary: $43,614) • Avionics Technicians(Annual Salary: $59,906) • Civil Drafters(Annual Salary: $54,678) • Civil Engineering Technicians(Annual Salary: $56,380) • Electrical Engineering Technicians(Annual Salary: $57,114) • Electromechanical Equipment Assemblers(Annual Salary: $31,617) • Electronics Engineering Technologists(Annual Salary: $63,280) • Engineering Managers(Annual Salary: $118,081) • Engineering • Materials Engineers(Annual Salary: $85,651)Materials Scientists(Annual Salary: $116,053) • Marine Engineers(Annual Salary: $85,794) • Mechanical Engineering Technicians(Annual Salary: $49,368) • Mechatronics Engineers(Annual Salary: $83,246) • Nanosystems Engineers(Annual Salary: $83,246) • Nuclear Equipment Operation Technicians(Annual Salary: $75,480) • Numerical Tool and Process Control Programmers(Annual Salary: $50,636) • Transportation Engineers(Annual Salary: $79,750) • Accountants (Annual Salary: $74,421)Actuaries (Annual Salary: $102,825) • Auditors(Annual Salary: $73,820) • Cost Estimators(Annual Salary: $68,598) • Home Economics Teachers, Postsecondary (Salary Unavailable) • Mathematicians(Annual Salary: $92,021) • Statisticians(Annual Salary: $78,700)
www.newhavenscience.org/STEM STEM Career exploration For each video… let’s discuss: What problems does this career solve? What type of student would be interested? What do they need to be ready for this career?
“Fun games — see how science, technology, engineering, and mathematics are actually applicable to real life.” —Engineering Student “Expose them at an early age, show them it is fun and interesting.” —Biomedical Sciences Student “Parents can be more hands on and supportive in teaching their children outside of school to help reinforce what is learned in school. Schools should also have a lot more hands on and visual learning rather than always reading from the textbook. For example, instead of reading about photosynthesis take the students outside and show them photosynthesis.” —Pre-Med Student STEM Students: What Can Parents and Schools Do to Help Kids and Teens Become Interested in STEM? The word cloud illustrates keywords used by students to indicate how parents and schools can make STEM more interesting for kids. Larger words represent higher frequencies while smaller words represent lower frequencies. Base: All College Students (n=500) Q950: What can parents and schools do to help kids and teens become interested in science, technology, engineering and mathematics?
Among careers tested, the two careers parents most want their child to pursue are scientist and engineer; overall, half of parents say they would like their child to pursue a STEM career. On the other hand, parents think their kids are more interested in becoming performers or artists. Parents who give their child’s school an “A” on its ability to prepare students for careers in STEM are more likely to say their child wants to pursue a STEM career (52% vs. 38% give school a “B” or lower). Parent and Child Career Hopes Reported by parents; top responses shown Dads are more likely to want their child to pursue a STEM career (57% vs. 44% moms). Teacher Entrepreneur Business Executive Lawyer Artist or Designer Financial Professional Actor/Musician/Performer Military Personnel Professional Athlete No Preferences /Don’t Know Base: All Parents of Child in Grades K–12 (n=854) Q1020: Which of the following careers, if any, would you like your child to pursue? Which of the following, if any, do you think your child will want to pursue?
Parents and STEM students agree that there is room for improvement in K–12 STEM education — only 1 in 5 STEM students feel they were extremely well-prepared for their college STEM courses. STEM College Students: How Well Did Your K–12 Education Prepare You for College? What did your school do to help prepare you? Parent Rating of K–12 STEM Prep Females in STEM are more likely than males to say they were extremely/well- prepared (64% vs. 49%) “AP courses were offered at my high school so I was able to gain a good foundation in Calculus and Physics.” “My schools prepared me for college workloads by sometimes giving college entry level work. Also quite often we would be given opportunities to take a college course or something of that sort.” What could your school have done to better prepare you? “More in-depth curriculum.” “Offer more AP courses and also more opportunities for hands-on experience and programs with each field.” “More application, less theory.” Base: All Qualified Respondents (College Students: n=500, Parents of Child in Grades K–12: n=854) Q910: How well did your K–12 education (elementary through high school) prepare you for your college courses in science, technology, engineering and/or math? Q915: What could your school have done to better prepare you/What did your school do that helped prepare you for your college courses in STEM? (OPEN END) Q1055: What grade would you give your child’s school on its ability to prepare students for careers in science, technology, engineering and/or mathematics?
The majority of college students and parents believe that preparing students for careers in STEM should be a priority for K–12 schools in the U.S.; however, only half believe it actually is a top priority in schools. The State of STEM Education in the U.S. % agree among students and parents Female students are more likely than their male counterparts to say that preparing students for STEM should be a top priority in K–12 schools (92% vs. 84%) — another indication of how important K–12 education is for girls. STEM College Students Parents of K–12 Students While parents may feel that K–12 schools are not meeting expectations when it comes to STEM, many are not extremely willing to spend their own money helping their children be successful in their math and science classes (24% extremely willing vs. 37% very willing, 34% somewhat willing, and 5% not at all willing). ________ ____ 76% of parents feel that the U.S. is doing a poor job of teaching STEM compared to other countries. __ Base: All Qualified Respondents (College Students: n=500, Parents of Child in Grades K-12: n=854) Q940/Q1060: How strongly do you agree or disagree with each of the following statements? Q1050: How willing would you be to spend extra money to help your child(ren) be successful in their math and science classes?
So why do parents feel that STEM education should be a priority? About half say it’s to ensure that the U.S. remains competitive in the global marketplace and also to produce the next generation of innovators. Preparing students to have well-paying and fulfilling careers are less important. Parents: Why Should Preparing Students for STEM Careers Be a Top Priority for Schools in the U.S.? Up to 3 responses selected Dads are more likely than moms to list this is a reason (62% vs. 47% moms). Parents in high-income households are least likely to give enabling students to have well-paying careers as a reason (29% in $75K+ households vs. 37% in <$35K, 42% $35–49.9K, 46% in $50–74.9K). Moms are more likely than dads to list this as a reason (36% vs. 22% dads). Base: Parents who agree that STEM preparation should be a top priority for schools (n=774) Q1065: Why do you think preparing students for careers in STEM should be a top priority for schools in the United States. Please select up to three responses.
Although a good K–12 education is necessary for building a foundation and interest in STEM, students say that having a passion for STEM and studying hard are the two most important factors to their success. External factors, such as K–12 education, mentors and role models, are less important. STEM Students: How Important Is Each Factor to Your Success? % Absolutely Essential/Extremely Important Female students are more likely to cite “studying hard” as an important success factor (81% vs. 60% males). Female students aremore likely than males to say “supportive parents” is an important success factor (50% vs. 37% males). Base: All College Students (n=500) Q920: How important are each of the following to your success as a student studying in your area or major?
Nearly three-quarters of STEM students report that their parents had at least some influence on their decision to study STEM; many parents want their child to pursue a STEM career and almost none discourage it. Students: Parent Influence and Encouragement Parents: How influential do you think you will be on your child’s future career path? How influential were your parents on your decision to study STEM? Percentage that said “At least somewhat influential”: 73% Females more likely than males to say their mother was extremely influential and encouraged a lot. Percentage that said “At least somewhat influential”: 72% Percentage that said “At least somewhat influential”: 97% While few parents have discouraged STEM careers, students who have parents in STEM careers are more likely to say their parent influenced and encouraged them. Growing up, to what extent did your parents encourage or discourage you from pursuing a career in STEM? Percentage that said “Encouraged”: 67% Percentage that said “Encouraged”: 66% Base: College Students with mother/father in life (variable base) Q880: How influential were your mother and father on your decision to be pre-med/to study in your area or major? Q890: When you were growing up, to what extent did you mother and father encourage or discourage you from pursuing a career in science, technology, engineering or mathematics? Base: All Parents of Child in Grades K–12 (n=854) Q1015: How influential do you think you will be on your child(ren)’s future, specifically the career path they may decide to pursue?
Parents have high, unmet expectations for schools when it comes to STEM education, but are they willing to help make up the difference themselves? Parents: How Confident Are You Helping Your Child With Their Math and Science Homework? Parents: How Willing Would You Be to Spend Money to Help Your Child Be Successful in Math and Science? 61% Extremely/very willing Dads (58% vs. 42% moms) and parents in STEM careers (68% vs. 43% non-STEM careers) are more confident in their abilities to help. Parents: If You Had an Extra $100 to Spend Each Month on Your Child, How Would You Be Most Likely to Spend It? Enrichment program in reading or LA Base: All Parents of Child in Grades K–12 (n=854) Q1045: How confident are you that you have the skills to help your child with their math and science homework if they asked for your assistance? Q1050: How willing would you be to spend money to help your child(ren) be successful in their math and science classes? Q1030: Assuming all of your child’s basic needs are met, if you had an extra $100 to spend each month on your child, in which of the following ways would you be most likely to spend that money? Music, art, or dance lessons Enrichment program in math or science Sports team expenses Clothing Entertain- ment A cell phone Some other way
Students are choosing to pursue a STEM degree, not because someone encouraged or told them to or even because the U.S. is in need, but to secure their own futures and because they find it intellectually stimulating/challenging. Reasons College Students Choose STEM Degrees #1 reason for males and pre-med students #1 reason for females and engineering & science students #1 reason for technology students (Note: Does not make top 3 list for any other major) Male students are more likely to pursue STEM because they have always enjoyed games/toys, etc. (51% vs. 35% females). Female students are more likely than male students to say that they chose STEM to make a difference (49% vs. 34% males). Of all STEM students, pre-med are most likely to give this is a reason (67% vs. 50% in science, 35% in engineering and 12% in technology). Black and Hispanic students are less likely than white and Asian students to say they chose STEM because they were encouraged by a teacher or guidance counselor. Base: All College Students (n=500) Q810: Why did you choose to pursue this type of education?
How can Parents HELP encourage STEM?(see brochure!) • See brochure • Create INTEREST, be POSITIVE! • Guide them to STEM careers! • Everyday science, encourage curiosity • EXPERIENCES, informal and programs • Perseverance, especially in math
What do they need? • MATH, 4 years in high school, problem solving • SCIENCE, lab based (including chemistry, maybe physics) • STEM SKILLS: same as 21st century skills • Be involved: STEM programs and mentoring