Download
1 / 21
220 likes | 626 Vues
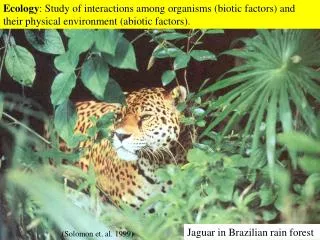
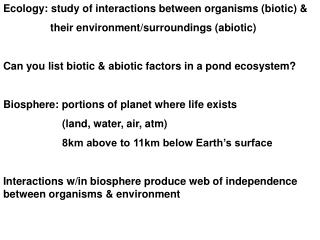
Ecology: study of interactions between organisms (biotic) & their environment/surroundings (abiotic) Can you list biotic & abiotic factors in a pond ecosystem? Biosphere: portions of planet where life exists (land, water, air, atm)

E N D
Ecology: study of interactions between organisms (biotic) & their environment/surroundings (abiotic) Can you list biotic & abiotic factors in a pond ecosystem? Biosphere: portions of planet where life exists (land, water, air, atm) 8km above to 11km below Earth’s surface Interactions w/in biosphere produce web of independence between organisms & environment
Levels of Organization Biome species
Autotrophs:producers capture sun’s energy & use inorganic compounds (H2O & CO2) chemical energy stored in food/sugars & produce O2 in Photosynthesis * Photosynthesis removes CO2 & adds O2 to atm Chemosynthesis:uses chemical energy in bonds carbs Ex. sulfur bacteria (volcanic vents, hot springs) H2S + O2 sulfur cmpds w/ chemical energy that converts CO2 in sea H2O carbs
Sunlight main energy source for all life on Earth Photo autotrophs capture sunlight energy food energy In photosynthesis < 1% of sun’s energy that reaches Earth is used by living things
Heterotrophs: Can’t harness sun’s energy Consumers Rely on other organisms for energy/food
Omnivores Eat plants and animals! Hamburger (from cow) Lettuce (plant) Roll (wheat- from plant) Pickle (cucumber/plant)
Detritovores: Feed on plant/animal remains (mites, earthworms, crabs, snails)
Decomposers: break ↓ organic matter Fx at any level Ex. Bacteria & Fungi, Mushrooms, Molds, Yeasts
Scavengers: Carnivores that feed on dead bodies
Feeding Relationships Energy flows in 1 direction through ecosystem Suninorganic cmpdsautotrophsconsumers/heterotrophs Food chain: energy stored by producers passes through ecosystem along food chain. Arrows = flow of energy Food Web: Network of complex interactions that link food chains
Identify the: 1. Producers 2. Primary Consumers 3. Secondary Consumers 4. Herbivores 5. Carnivores 6. Omnivores 7. What elements are missing from this food web? Food Web
Activity Construct a Food web using the following animals. This ecosystem represents a farm area. The corn is the main source of food for many of the herbivores in the area. You do not have to draw pictures, you can just use the animal names and draw arrows between them. SNAKE, CORN , CATERPILLAR, DEER, CROW, MOUSE, COUGAR, SQUIRREL, MICROORGANISMS (decomposers)
Trophic Levels: Only 10% of available energy transferred Some lost as heat energy ~1/2 of light energy captured stored in plants as food. Rest used for growth & metabolic processes. Why can’t there be LOTS of trophic levels? 5th trophic level 4th trophic level 3rd trophic level 2nd trophic level 1st trophic level
Ecological Pyramids: Diagrams that show relative amount of energy/matter w/in each trophic level Energy Pyramid: Limits # of Trophic Levels Only 10% of energy availbale w/in trophic level transferred to next level b/c organisms use much of energy consumed for life processes (CR, mvmt, growth, development)
Biomass Pyramid: Amount of living tissue w/in trophic level Pyramid of Numbers: Based on # of organisms w/in each trophic level
Ecological Pyramids Ecological Pyramids Section 3-2 Energy Pyramid Shows the relative amount of energy available at each trophic level. Organisms use about 10 percent of this energy for life processes. The rest is lost as heat. Pyramid of Numbers Shows the relative number of individual organisms at each trophic level. Biomass Pyramid Represents the amount of living organic matter at each trophic level. Typically, the greatest biomass is at the base of the pyramid.