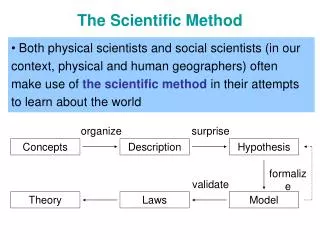
The Scientific Method
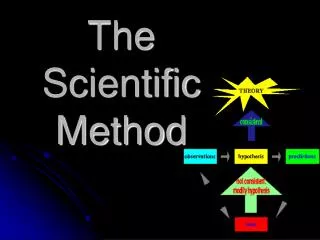
The Scientific Method. Formulation of an H ypothesis P lanning an experiment to objectively test the hypothesis Careful observation and collection of D ata from the experiment I nterpretation of the experimental results. Steps in Experimentation. The Well-Planned Experiment. Simplicity

The Scientific Method
E N D
Presentation Transcript
The Scientific Method • Formulation of an Hypothesis • Planning an experiment to objectively test the hypothesis • Careful observation and collection of Data from the experiment • I nterpretation of the experimental results
The Well-Planned Experiment • Simplicity • don’t attempt to do too much • write out the objectives, listed in order of priority • Degree of precision • appropriate design • sufficient replication • Absence of systematic error • Range of validity of conclusions • well-defined reference population • repeat the experiment in time and space • a factorial set of treatments also increases the range • Calculation of degree of uncertainty
Types of variables • Continuous • can take on any value within a range (height, yield, etc.) • measurements are approximate • often normally distributed • Discrete • only certain values are possible (e.g., counts, scores) • not normally distributed, but means may be • Categorical • qualitative; no natural order • often called classification variables • generally interested in frequencies of individuals in each class • binomial and multinomial distributions are common
Terminology • experiment • treatment • factor • levels • variable • experimental unit (plot) • replications • sampling unit • block • experimental error • planned inquiry • procedure whose effect will be measured • class of related treatments • states of a factor • measurable characteristic of a plot • unit to which a treatment is applied • experimental units that receive the same treatment • part of experimental unit that is measured • group of homogeneous experimental units • variation among experimental units that are treated alike
Barley Yield Trial Experiment Hypothesis Treatment Factor Levels Variable Experimental Unit Replication Block Sampling Unit Error
Hypothesis Testing • H0: = ɵ HA: ɵ or H0: 1= 2 HA: 1 2 • If the observed (i.e., calculated) test statistic is greater than the critical value, reject H0 • If the observed test statistic is less than the critical value, fail to reject H0 • The concept of a rejection region (e.g. = 0.05) is not favored by some statisticians • It may be more informative to: • Report the p-value for the observed test statistic • Report confidence intervals for treatment means
Hypothesis testing • It is necessary to define a rejection region to determine the power of a test Decision Accept H0 Reject H0 Reality H0 is true 1 = 2 HA is true 1 2
Power of the test • Power is greater when • differences among treaments are large • alpha is large • standard errors are small
Review - Corrected Sum of Squares • Definition formula • Computational formula • common in older textbooks correctionfactor uncorrected sum of squares
df = df = 6 df = 3 Review of t tests To test the hypothesis that the mean of a single population is equal to some value: df = n-1 where Compare to critical t for n-1 df for a given (0.05 in this graph)
Review of t tests To compare the mean of two populations with equal variances and equal sample sizes: where df = 2(n-1) The pooled s2 should be a weighted average of the two samples
Review of t tests To compare the mean of two populations with equal variances and unequal sample sizes: where df = (n1-1) + (n2-1) The pooled s2 should be a weighted average of the two samples
Review of t tests • When observations are paired, it may be beneficial to use a paired t test • for example, feeding rations given to animals from the same litter • t2 = F in a Completely Randomized Design (CRD) when there are only two treatment levels • Paired t2 = F in a RBD (Randomized Complete Block Design) with two treatment levels
Measures of Variation s (standard deviation) CV (coefficient of variation) se (standard error of a mean) L (Confidence Interval for a mean) (standard error of a difference between means) LSD (Least Significant Difference between means) L(Confidence Interval for a difference between means)