Download
1 / 45
450 likes | 606 Vues
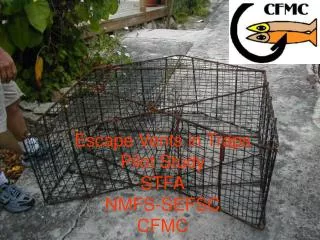
Implementing Trap Vents CFMC has provided $5,000 This will purchase 6,250 Vents for 3,125 Traps. randomization test reference: Manly , B. F. J. 2006. Randomization, Bootstrap and Monte Carlo Methods in Biology, 3rd Edition. Chapman and Hall/CRC. . Impact of CFMC Vents.

E N D
Implementing Trap VentsCFMC has provided $5,000This will purchase 6,250 Vents for 3,125 Traps
randomization test reference: Manly, B. F. J. 2006. Randomization, Bootstrap and Monte Carlo Methods in Biology, 3rd Edition. Chapman and Hall/CRC.
STFA/SCCFA Spiny Lobster Project Second Progress Report 3/26/2013
Tagging and MeasuringFloy “Spaghetti” Tags Inject tag between the tail and end of carapace Measure with calipers to the nearest 1 mm CL Check tag security
Lobster Growth STT and Cuba (𝐿∞=𝐿∞(1−𝑒(−𝑘(𝑡−𝑡0)))
Mortality Calculation • Von Bertalanffy growth equation . • Solve for (t) for carapace length. • This provides the age for each size class in the size frequency distribution so that total mortality (Z) Where: is the number of lobsters at time (t) and (t-1)andZ is the rate of total mortality. can be calculated as the difference in numbers from the size class bin at full recruitment and the size class bin containing L
St. Thomas Complete Trips Full Recruitment (N=137) 7.1 Years Z=0.316 L∞ N=1
St. Croix Complete Trips Full Recruitment (N=112) Z=0.959 2.4 Years LfinalN=2
Population Analysis • Review of CCR data showed that following 1997, the data for total traps owned was input instead of daily trap hauls. • Only affects fishermen hauling more than one day per week (i.e. bigger fishermen). • Interviewed all fishermen showing “unreasonable” daily trap haul numbers. • Multiplied interview results by number of trips to obtain adjusted trap haul values.
Comparison Between Annual Trap Hauls andCCR Reports and Fishermen Interviews
From: steve.turner@noaa.govTo: Olsen41@aol.comCC: david.gloeckner@noaa.gov, Bonnie.Ponwith@noaa.gov, roy.pemberton@dpnr.gov.viSent: 2/12/2013 10:00:32 A.M. Paraguay Standard TimeSubj: Re: Fishermen Trap Haul Survey Dear David We have been asked by the VI DFW to have all requests for VI data routed through them so that they can be aware of all requests for their data and to respond to those requests if it is within their capability. Therefore would you please forward your requests to the chief fisheries scientists at DFW. The SEFSC Fisheries Statistics Division is be willing to assist the VI DFW with meeting such requests where we have capabilities for extracting information which they might not have. Regards Steve Turner Chief, Fisheries Statistics Division
Island Differences in Methods2006 CCR Data Average sizes are significantly different between Islands (F= 102.7, p<0.001) Difference between size of Trap and SCUBA caught lobsters on St. Croix not significant (F=0.76, p=0.38)
Lobster Assessments Evidence/Data • Catch by gear. • CPUE-based abundance indices (calculated from summary data due to lack of access). • Size distribution of catches. Analysis • Statistical estimation of initial population size, recruitment history, and fishing mortality rates by fitting catch, CPUE, and size data.
Assessment Details Drivers of this assessment model: • Size data and catch-CPUE data series give two pictures of fishing mortality rates and recruitment strength. • Potential for conflict between these two datasets. Recruitment • No attempt at fitting a stock-recruitment relationship within the model. • Instead, this relationship can be evaluated after the fact.
Draft Results • St. Thomas-St. John—conflict between two sources of information: • Increasing catches without signs of decrease in CPUE or average size. Model provides increasing recruitment but this conflicts with relatively stable age distribution. • St. Croix—similar conflict albeit with increasing CPUE May be a data problem, particularly in recent years. May be an artifact from the way the SEFSC query was constructed.
Management Advice • Results are not yet suggestive that we understand the productive capacity of this stock. Things may be complicated by a stock range that spans beyond the assessment area (BVI, PR, etc). • May not apply to St. Croix (isolated sea mount not connected). • Results are suggestive that current fishing pressure is sustainable—no evidence of decline in CPUE or average size on St. Thomas, however decline in average size observed on St. Croix. • National Standard 1 advice on data-poor stocks with no evidence of decline: set catch limits as a function of average landings. • Average landings have been increasing and current ACLs include low years at the start of the period, thereby reducing average. • St. Croix may have data problem, and raises more concerns because the average size lobster is smaller and sizes have been decreasing.
Preliminary Conclusions • Combination of catch weight, catch per unit effort, and size distribution of catches may be sufficient to assess the lobster stock. • Recent data are necessary, as is further review of the catch, index, and size data. • Even if assessment results are uncertain, management advice can be provided via a management strategy evaluation that compares policies against objectives (see Nowlis 2004, Bulletin of Marine Science)