Download
1 / 20
200 likes | 384 Vues
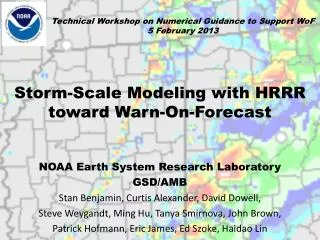
Storm-scale data assimilation and ensemble forecasting for Warn-on-Forecast. 5 th Warn-on-Forecast Workshop Dusty Wheatley 1 , Kent Knopfmeier 2 , and David Dowell 3

E N D
Storm-scale data assimilation and ensemble forecasting for Warn-on-Forecast 5th Warn-on-Forecast Workshop Dusty Wheatley1, Kent Knopfmeier2, and David Dowell3 1,2Cooperative Institute for Mesoscale Meteorological Studies, University of Oklahoma, and NOAA/National Severe Storms Laboratory, Norman Oklahoma 3NOAA/Earth Systems Research Laboratory, Boulder, Colorado 2 April 2014
Work highlights • Move to a GEFS-based NSSL Mesoscale Ensemble (NME) • Provides for a regional convection-allowing (grid spacing ~3 km) ensemble on which to perform radar DA • Baseline EnKF experiment for 24 May 2011 using NME background • New initialization techniques + radar DA • Convective initiation/suppression using an updraft nudging technique
NSSL Mesoscale Ensemble (NME) • Currently: Regional convection-allowing grid (spacing 3 km) is event dependent • Ongoing work to consider the use of a single grid with horizontal spacing of 3 km
Retrospective work: • 27 April 2011 • Spring tornado outbreak • Southeastern United States • 24 May 2011 • Warm season tornadic event • Central Oklahoma • 17 November 2013 • Cool season tornadic event • Midwestern United States
24 May 2011 Tornadic Event • First tornado reports in Oklahoma between 2015 – 2043 UTC
Ensemble description • WRF-ARW v3.4.1 • 36-member ensemble, with physics diversity (same for storm-scale ensemble) • Microphysics: Thompson • Cumulus: Kain-Fritsch, Grell, Tiedtke • Radiation (LW/SW): RRTM/Dudhia, RRTMG/RRTMG • PBL: YSU, MYJ, MYNN • IC/BCs for *both* parent/nested grids downscaled from 21-member Global Ensemble Forecast System (GEFS) at 0000 UTC 24 May 2011 • No IC/BC perturbations • Parent/nested grids run simultaneously—from 0000 UTC—in a 1-way nest setup • Only information exchange occurs at nest’s lateral boundary
Mesoscale data assimilation • EnKF approach encoded in the Data Assimilation Research Testbed (DART) • ‘Conventional’ observations (METAR, marine, radiosonde, ACARS, satellite-derived winds) assimilated every 1 h until 0300 UTC 25 May 2011 • Mesonet data assimilation on nested grid only • No radar data assimilation in producing backgrounds
Ensemble-mean specific humidity at 1800 UTC Dryline • System coupled with either NOAH or RAP land surface models
Model soundings at 1800 UTC • Near convective initiation • At KOUN in Norman, OK
Storm-scale experiments • Start on nested grid at 1900 UTC • Assimilate radial velocity and reflectivity (and mesonet) data every 5 min through the period 1900 – 2030 UTC • Frederick (KFDR), Vance Air Force Base (KVNX), and Twin Lakes (KTLX) WSR-88D’s • Cleaned radar data objectively analyzed to 6-km grid using Observation Processing and Wind Synthesis (OPAWS) • Additive noise (T, Td, u, v) where refl. obs. indicate precip. • Launch 1-h storm-scale ensemble forecasts (with no assimilation) at 2000 and 2030 UTC 24 May
Probability of REFL > 40 dBZ at 1.5 km AGLTop row: 1-h FCST init. @ 2000 UTC Bottom row: 1-h FCST init. @ 2030 UTC
Vorticity swaths • Probability of low-level (below ~2 km) vorticity exceeding some threshold; calculated every 5 min during 1-h forecast period • Maximum probability value retrieved at each model gridpoint Canton Lake EF-3, 2015-2043 Lookeba EF-3, 2031-2046 El Reno EF-5, 2050-2235
Forecast cold pools • Ensemble mean 2-m temp. field calculated every 5 min during forecast period • Minimum 2-m temp. value retrieved at each model gridpoint
Updraft nudging technique • In the manner of Naylor and Gilmore (2012) • Modification to w tendency fields in the model • Use radar reflectivity observations from the NSSL National Mosaic to automatically select where to: • initiate observed storms that are absent in the model forecasts • suppress unobserved regions of simulated storms • REFL obs. swapped out every 10 min • Ultimately, a complement (not a substitute) to radar DA, similar to additive noise
No wforce No wforce With wforce
Probability of REFL > 40 dBZ at 1.5 km AGL25-min fcst valid 1940 UTC
Ongoing Work • Collective evaluation of backgrounds generated for earlier listed cases, and severe events during the period 15 – 31 May 2013 • Impact of choice of land surface model • Impact of horizontal resolution, microphysics, etc. on storm-scale results • Further investigate the use of updraft nudging technique within ensemble-based framework • Use the Gridpoint Statistical Interpolation (GSI) software for preprocessing observations and computing prior ensemble estimates