Your Institutional Report 2014 – Step by Step
720 likes | 942 Vues
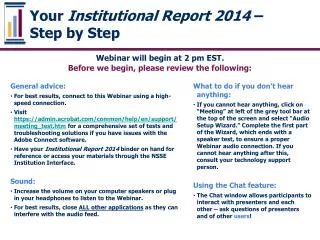
Your Institutional Report 2014 – Step by Step. General advice: For best results, connect to this Webinar using a high-speed connection.

Your Institutional Report 2014 – Step by Step
E N D
Presentation Transcript
Your Institutional Report 2014 – Step by Step General advice: • For best results, connect to this Webinar using a high-speed connection. • Visit https://admin.acrobat.com/common/help/en/support/meeting_test.htm for a comprehensive set of tests and troubleshooting solutions if you have issues with the Adobe Connect software. • Have your Institutional Report 2014 binder on hand for reference or access your materials through the NSSE Institution Interface. Sound: • Increase the volume on your computer speakers or plug in your headphones to listen to the Webinar. • For best results, close ALL other applications as they can interfere with the audio feed. What to do if you don’t hear anything: • If you cannot hear anything, click on “Meeting” at left of the grey tool bar at the top of the screen and select “Audio Setup Wizard.” Complete the first part of the Wizard, which ends with a speaker test, to ensure a proper Webinar audio connection. If you cannot hear anything after this, consult your technology support person. Using the Chat feature: • The Chat window allows participants to interact with presenters and each other – ask questions of presenters and of other users! Webinar will begin at 2 pm EST. Before we begin, please review the following:
Your Institutional Report 2014 – Step by Step A NSSE Webinar Presented by Jillian Kinzie Bob Gonyea August 27, 2014
Webinar Goals • QUICK Overview of the updated survey • Guided tour of your NSSE Institutional Report 2014 • Review reports • Interpreting results • Highlight user resources • Tips for generating discussion and action on your campus • Q & A
An Updated NSSE Higher education is constantly changing, and it is important for NSSE to stay relevant to the most salient issues and priorities of institutional assessment and research.
Design Principles • Build on NSSE’s strengths • Focus on behavior & effective practice • Actionable information • New content must… • Inform engagement • Be based in the literature • Be thoroughly tested
Development Process • Internal committee work started in 2009 • Consultation with external advisors • Feedback from institutional users • Experimental item testing: 2006 to 2011 • Pilot testing: 2011 & 2012 • Extensive psychometric analyses • Focus groups and cognitive interviews
NSSE at 13! • What We’ve Learned… connect engagement data to indicators of success; student behaviors; institutional improvement is possible • Updating NSSE… same focus; new & refined measures; updated terminology • Emerging areas of interest – HIPs, quantitative reasoning, effective teaching, deep approaches, topical modules What are your questions/comments?
Summary of NSSE Changes * Offset by deletions
Student Engagement • Student engagement is a domain of constructs representing two critical features of collegiate quality. • The amount of time and effort students put into educationally purposeful activities, and • How the institution organizes the curriculum and other learning opportunities to get students to participate in such activities.
Engagement Indicators more specific & actionable! The Updated NSSE From Benchmarks to Engagement Indicators and High-Impact Practices
Engagement Indicators more specific & actionable! The Updated NSSE From Benchmarks to Engagement Indicators and High-Impact Practices
Engagement Indicators more specific & actionable! The Updated NSSE From Benchmarks to Engagement Indicators and High-Impact Practices
Your NSSE binder experience… How many NSSE binders have you opened? • This is my first! • Only one other • At least five • A fair share (but I need a refresher)
Updated NSSE Institution Interface Remember, electronic reports and data are available online
Online Tools – Share & Generate Reports! NSSE Report Builder–Institution Version
Institutional Report Organization Four tabs, each begins with an Overview: Tab 1: NSSE – National Survey of Student Engagement Tab 2: FSSE – Faculty Survey of Student Engagement Tab 3: BCSSE – Beginning College Survey of Student Engagement Tab 4: User Resources
Exploring Tab 1 College of Saint Benedict
(in progress) • Snapshot • Engagement Indicators • High-Impact Practices • Frequencies and Statistical Comparisons • Topical Module(s) and/or Consortium Reports • Respondent Profile • Administration Summary • Selected Comparison Groups • Pocket Guide Report • Major Field Report • Student Comments
Snapshot • The Snapshot is designed to be shared on campus • 4-pages, folded pamphlet style
Snapshot Snapshot (p. 1)
Snapshot Snapshot(p. 2)
Snapshot Snapshot(p. 3)
Snapshot Snapshot(p. 4)
Engagement Indicators • Engagement Indicators are summary measures based on sets of NSSE questions • The ten indicators are organized within four themes: Academic Challenge, Learning with Peers, Experiences with Faculty, and Campus Environment. • Report contains:Overview (p. 3) Theme reports (pp. 4-13) Comparisons (p. 15) Detailed Statistics (pp. 16-19)
Engagement Indicators Engagement Indicators
Engagement Indicators Engagement Indicators
Engagement Indicators Engagement Indicators • Box-and-whisker plots 95th Percentile 75th Percentile Mean (dot) Median (line) 25th Percentile 5th Percentile
Engagement Indicators Engagement Indicators
Engagement Indicators Engagement Indicators Comparisons with High-Performing Institutions
High-Impact Practices High-Impact Practices OverallHIPParticipation
High-Impact Practices High-Impact Practices Statistical Comparisons
High-Impact Practices High-Impact Practices Response Detail
High-Impact Practices High-Impact Practices Participation by Student Characteristics
Frequencies & Statistical Comparisons • Do you have specific questions about individual items? • This report gives complete descriptives for all survey questions, count and weighted percentage of responses to all survey items for randomly selected students • Details on weighting can be found at http://nsse.iub.edu/_/?cid=404
Frequencies & Statistical Comparisons Frequencies and Statistical Comparisons
Frequencies & Statistical Comparisons Statistical Comparisons • Provide statistical significance and effect size • Effect size: Are results different in a practical sense?
Additional Questions Topical Modules for 2014 • Academic Advising • Civic Engagement • Development of Transferable Skills • Experiences with Diverse Perspectives • Learning with Technology • Experiences with Writing • Global Perspectives • Information Literacy
Additional Questions: Topical Module Sample Topical Module Report: Academic Advising
Additional Questions: Consortium Report Consortium Report – similar to module report
Administration Details • Administration Summary Report • Population and Respondents • Response Rate and Sampling Error • Representativeness and Weighting
Administration Details: Respondent Profile Respondent Profile
Administration Details: Selected Comparison Groups Selected Comparison Groups Report • Tells how peer groups have been selected • consortium participation • criteria selected • default groups, if no instructions given • Lists schools included in each peer group
Tab I: NSSE • How to make productive use all these reports and the data file!??! • Take advantage of dichotomized response presentation in reports • Present % “never” to sharpen focus • Syntax & other analytical resources available: • nsse.iub.edu/html/analysis_resources.cfm
Pocket Guide to Choosing a College • Customizable template enables sharing with prospective students & families, admissions officers, and orientation staff
Major Field Report • Engagement Indicators, HIPs, Frequencies & Statistical Comparisons for up to ten customizablecategories of related majors • Part I: “within-institution” report presents results within related-major categories side by side for first-year students and seniors • Part II: “between-institution” report compares your respondents with those of your comparison groups for up to ten related-major categories For more information: nsse.iub.edu/html/major_field_report.cfm Get More Traction with your NSSE Results!!
Questions About Reporting? • Any challenges? • What’s most useful? • Your Questions/Concerns: • Concerns about response rates • Relating NSSE 2014 results to past years • Assessing engagement in multiple modalities • Best practices in using NSSE data
Additional Resources • NSSE Data File • Downloadable from the Institution Interface • Includes all data collected for your institution • Merge data with other student records