Download
1 / 21
210 likes | 540 Vues
Analysis of Amplification Effect in Mortgage Service Game . Ayşe Nur Koç Erkan Bayraktar Ekrem Tatoğlu Bahçeşehir University İstanbul, Turkey. Information Distortion.

E N D
Analysis of Amplification Effect in Mortgage Service Game Ayşe Nur Koç Erkan Bayraktar Ekrem Tatoğlu Bahçeşehir University İstanbul, Turkey
Information Distortion • Information distortion as known as the amplification/bullwhip effect is a phenomenon whereby a small change in demand of end customers is amplified as it goes upstream. • Cook et al. (2002) • Thediscernments between manufacturing and services industry is not always as “white and black”, there is sometimes “a gray area”.
Information Distortion in Services • Akkermans and Vos (2000) • A case study on telecommunication as a service industry. • No “bullwhip effect” because of batch ordering and shortage-gaming as in manufacturing. • An additional root cause: • “interactions of high workloads and reduced process quality that start reinforcing each other in a vicious cycle once workloads pass a certain threshold” • A potentially very powerful counter-measure is to implement quality improvements throughout the service chain
Information Distortion in Services • Mortgage Service Game by Anderson and Morrice (2000): • Study the decision-making in service-oriented supply chains which consists four process steps: • initial processing, credit checking, surveying and title checking. • Usedbacklog instead of finished goods inventories. Each process can only control its backlog by managing its capacity that is the number of employees. • The amplification effects are present in services. • Sharing the demand information throughout the supply chain is a perfect measure to reduce amplification effects.
Mortgage service game model • Each mortgage application passes through four stages: • initial processing: filling out the application with a loan officer • credit checking: confirmation of employment and review of credit history • surveying: a survey of the proposed property to check for its value, as well as any infringements upon zoning laws or neighboring properties • title checking:ensuring that the title to the property is uncontested and without liens
Bi,t = Backlog at stage i on day t Ci,t = Capacity at stage i on day t ri,t = Completion rate at stage i on day t r0,t= the new application start rate C*i,t = Target capacity (C*i,t ≥ 0) λ = the service delay time τ= the capacity adjustment time α = Rate of information sharing( 0 ≤ α ≤ 1 ) Mortgage service game model … Note: It is assumed that each employee has a productivity of one application per day.
Mortgage service game model: Application start rate • The system is simulated under four different application start rates: • Thefirst strategy (Anderson and Morrice, 2000): • Assumedthat the number of applications is 20 per day and then it jumps to 27 after 40th day and remains constant. • Simulate upto 100 week for verification and validation. • The other strategies: • Assumethat application start rate follows a uniform distribution for each day based on: • Low fluctation (U[19-21]), • Medium fluctation (U[18-22]), • High fluctation (U[15-25]).
Mortgage service game model: Initial parameters • Capacityadjustment time (τ):20 days • Servicedelay time (λ):10 days • Theproportion of the application start rate (α): 0 • Initial backlog for eachstage: 200 • Capacity: 20 per day • Target capacity: 20 applications per day.
Mortgage service game model: Simulation settings • Simulatedfor 540 weeks (2700 days). • The first 54 weeks (270 days) isremoved from the output analysis to eliminate the effect of warm-up period. • 20 replicationsfrom each scenario.
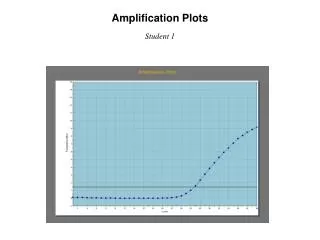
Model verification and validation • To verifyand validate the model, two main graphics that Anderson and Morrice (2000) showed in their study are compared with our results: • Applications Processing for All Stages over Time • Stage Backlogs over Time.
Simulation output analysis: …Time to stabilize the system • Identify how long it takes to eliminate fluctuations of completion rate which occur after the variation of application start rate throughout all stages, with respect to three parameters
Simulation output analysis: …Time to stabilize the system • System stabilizes slowly directly proportional to theparameter τ. • System stabilizes inversely proportional to the parameter λ. • System stabilizes faster inversely proportional to the parameter α.
Simulation output analysis: Main effects on information distortion 17
Simulation output analysis: Interaction effects on information distortion 18
Conclusion • This study noted also a highly significant finding that • low levels of capacity adjustment time and • high levels of information sharing,and • high levels of service delay time have a strongly positive impact on reducing the times for system stabilization. • This study noted a highly significant finding that • Lowlevels of capacity adjustment time, • Highlevels of service delay time, • High proportion of information sharing and • Increasing variability on application start rate have a positive impact on reducing the information distortion for all stages except initial stage.
Managerial implications • Shareinformation across the all stages of chain to mitigate the amplification effect. • While high information sharing would reduce target capacity accuracy, it has a positive influence on the reduction of the bullwhip effect. • SSC managers are therefore strongly suggested to operate information sharing by selecting higher value for to keep the amplification effect low, while at the same time to increase target capacity accuracy. • Also SSC managers are suggested to select higher values for λ and variability, lower value for to reduce the amplification effect based on the results of this study.
Further study • Our calculations on target capacity are limited only to use of backlogs and/or the application start rate. • Different methods on the calculations of target capacity would also considered (e.g., using capacity information of predecessor stages and/or successor stages). • This study may further be extended to evaluate the impact of information distortion on the performance measures of a four-stage services supply chain (e.g., backlog cost of the stages, total chain backlog cost, total cost of the stages, total chain cost).