Download
1 / 32
320 likes | 519 Vues
CONDUCT FACILITY ASSESSMENTS. Presented by: Ed Bain November 18, 2002. Customer Value Proposition

E N D
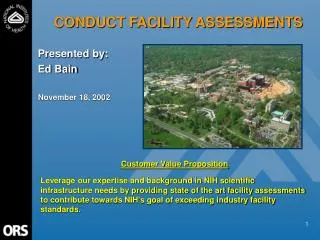
CONDUCT FACILITY ASSESSMENTS Presented by: Ed Bain November 18, 2002 Customer Value Proposition Leverage our expertise and background in NIH scientific infrastructure needs by providing state of the art facility assessments to contribute towards NIH's goal of exceeding industry facility standards.
Table of Contents Main Presentation ASA Template, Page 1…..…………………….……………………………………… 4 Customer Perspective……………………….……………………………………. 5 Customer Performance Objectives………….…………………………….. 6 Customer Segmentation …………………….…………………………….. 7 Customer Satisfaction……………………….……………………………… 8 Customer Measure, Increase Safety and Functionality……………. 9 Internal Business Process Perspective………………………………………… 10 Internal Business Process Performance Objectives…………………… 11 Service Group Block Diagram……………………………………………. 12 Conclusions from Discrete Services Deployment Flowcharts……… 13 Internal Business Process Measure, Improve Cycle Time…………… 14 Internal Business Process Measure, Improve FCI………..…………… 15 Learning and Growth Perspective……………………………………………….. 16 Learning and GrowthPerformance Objectives…………………………. 17 Conclusions from Turnover, Sick Leave, Awards, EEO/ER/ADR Data 18 Analysis of Readiness Index Conclusions………………………………. 19 Learning and Growth Measure, Train Customers to use Software….. 20
Table of Contents Main Presentation Financial Perspective………………………………………………………… 21 Financial Performance Objectives…………….……………………………. 22 Unit Cost………………………………………………………………………… 23 Asset Utilization……………………………………………………………….. 24 Financial Measure, Improve Building Deficiency Cost Data…………… 25 Conclusions and Recommendations…………………………………………….. 26 Improvements Implemented………………………………………………… 27 Conclusions from FY02 ASA..……………………………………………… 28 Recommendations…………………………………………………………… 29 Appendices……………………………………………………………………………… 30 Page 2 of ASA Template………………………………………………………………. 31 Process maps…………………………………………………………………………… 32
Customer Performance Objectives • Increase understanding of customer base • Increase customer satisfaction • Increase safety and functionality
Objective:Increase Understanding of Customer BasePerformance Measure:Customer Segmentation Customer Objective
Objective:Increase Customer SatisfactionPerformance Measure:Customer Survey for Facility Assessments Customer Objective • Customers will be surveyed electronically using the ORS scorecards. • Only facility assessment report recipients will be surveyed
Objective:Increase Safety and FunctionalityPerformance Measure:Square Footage Assessed on a 3 year Cycle Customer Objective Target = 3 Million SF / Year
Internal Business Process Performance Objectives • Increase understanding of process • Identify methods to measure process • Improve buildings Facility Condition Index
Conduct Facility Assessments: Block Diagram of Assessment Cycle Establish facility assessment schedule Program funding for next year Assess Buildings Determine FCIs Perform repairs Objective:Increase understanding of processPerformance Measure:Block diagram Internal Business Process Objective
Internal Business Process Objective Objective:Increase understanding of process Performance Measure: Discrete Services Deployment Flowcharts Conclusions: • Involved DCAB in the process • Reduce the time between the initial customer contact and presentation of the final results to the customer. • Process to update data before the next assessment
Objective: Identify Methods to Measure ProcessesPerformance Measure:Improve cycle time for assessment process Internal Business Process Objective Target = 120 Days
Objective:Improve Facility Condition IndexPerformance Measure:Decrease the FCI overall for all buildings Internal Business Process Objective 50% Target 10% 5%
Learning and Growth Perspective
Learning and Growth Performance Objectives • Enhance Quality of Work life for Employees in ORS • Maintain and Enhance Competencies for the Future Organization • Customers trained in use of Facilities Assessment Application
Objective:Enhance Quality of Work life for Employees in ORSPerformance Measure:Turnover, Sick Leave, Awards, and EEO/ER/ADR Data Learning and Growth Objective Observation: • 5.6 % employee turnover • Less than one week of sick leave used per employee • Approximately one award per employee • No EEO or ADR cases out of 18 employees Conclusions: • Zero turnover, not including retirement • Employees are satisfied and happy • Healthy environment and good working relationship among employees
Learning and Growth Objective Objective: Maintain and Enhance Competencies for the Future OrganizationPerformance Measure: Analysis of Readiness Index • Required skills: Contracting, facility management, coordination and planning, technical background • RMS staff have these skills and can assume duty of the Project Officer if necessary • Lack of personnel and skills in assessment and software application resulting in need for contract support
Learning and Growth Objective Objective:Customers trained in use of Facilities Assessment Software ApplicationPerformance Measure: Increase number of customers trained in use of Facility Assessment Software Target = 50%
Financial Performance Objectives • Minimize Unit Cost at a Defined Service Level • Maximize Utilization of Assets • Improve Building Deficiency Correction Cost Data
Financial Objective Objective: Minimize Unit Cost at a Defined Service Level Performance Measure: Change in Unit Cost Target
Financial Objective Objective: Maximize Utilization of Assets Performance Measure:Actual Asset Utilization 100% Asset Utilization
Financial Objective Objective: Improve Building Deficiency Correction Cost Data Performance Measure: % variation between budgeted costs and actual repair/replacement expenses Target = +/- 10%
Improvements Implemented: • Established a three year contract for assessment program • Completed first third of NIH campus (FY 02) • Began the second third of NIH campus (FY 03) • Completed assessment for off campus facilities at Rocky Mountain Laboratory, Montana and National Institute of Environmental Health Sciences in North Carolina • Included other facility management reports such as roof maintenance, indoor air quality and asbestos management program in to the facility assessment database
Conclusions from FY02 ASA Major findings: • Electronic links to other facility management and reports can not be made economically. • For security reasons, a link to the assessment database from ORS web page should not be established. • Backlog of Maintenance and Repair greater than expected • Most buildings in fair condition
Recommendations • Complete assessment cycle. • Assess other off campus facilities at GRC, Baltimore; New Iberia, Louisiana; Ft. Detrick, Maryland. • Use assessment data in planning and budgeting • Establish a policy goal for FCI at NIH. • Develop a process to update building deficiencies before next assessment. • Involve DCAB in the process. • Shorten assessment cycle.