
Uploaded by
trevor
6 SLIDES
159 VUES
60LIKES
Understanding Fault Movements in California through GPS Data Analysis
DESCRIPTION
Explore continuous GPS data from various sites in California, courtesy of MIT's campaign data. Study low-rate earthquake signals and fault-parallel total displacements along with vertical total displacements observed in Denali in 2002. Compare results from Hreinsdottir et al. (2006) and Larson et al. (2003) regarding high-rate earthquake signals in the Denali region. Analyze network displacements for comprehensive insights.
Download
1 / 6
Télécharger la présentation 
Understanding Fault Movements in California through GPS Data Analysis
An Image/Link below is provided (as is) to download presentation
Download Policy: Content on the Website is provided to you AS IS for your information and personal use and may not be sold / licensed / shared on other websites without getting consent from its author.
Content is provided to you AS IS for your information and personal use only.
Download presentation by click this link.
While downloading, if for some reason you are not able to download a presentation, the publisher may have deleted the file from their server.
During download, if you can't get a presentation, the file might be deleted by the publisher.
E N D
Presentation Transcript
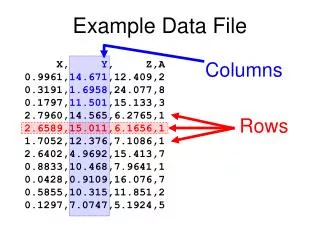
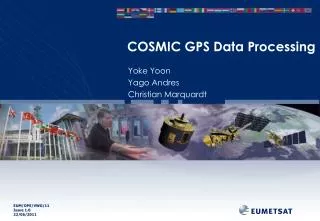
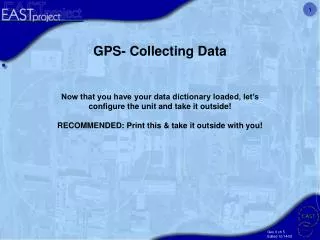
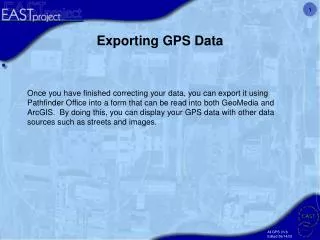
Continuous data S. California site (courtesy MIT)
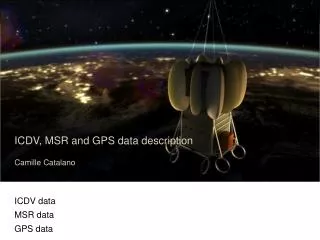
Low rate earthquake signal fault-parallel total displacement vertical total displacement Denali 2002 from Hreinsdottir et al., 2006
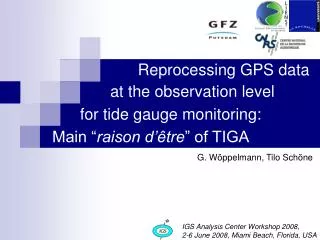
High rate earthquake signal Denali, 2002 from Larson et al., 2003
![Data Warehouse [ Example ]](https://cdn0.slideserve.com/577245/data-warehouse-example-dt.jpg)


More Related