Download
1 / 26
260 likes | 385 Vues
Monitoring system under the Norwegian management plans for the Barents Sea and Norwegian Sea. Knut Sunnanå EMODNET Seventh meeting of Marine Observation and Data Expert Group, Nov 25, 2009. Ecological Quality Objectives. Extensive reports on the Ecosystem

E N D
Monitoring system under the Norwegian management plans for the Barents Sea and Norwegian Sea. Knut Sunnanå EMODNET Seventh meeting of Marine Observation and Data Expert Group, Nov 25, 2009
Ecological Quality Objectives • Extensive reports on the Ecosystem • Understanding functioning of ecosystems • Assessment processes • Selection of indicators • Simplification • State, pressure and effect signals • Management rules
Main impacts up to 2020 • Petroleum industry: its expansion will be the main change in human activity in this period. Possible impacts from oil spills and risks related to rising transport volumes. • Fisheries: management is currently based on the precautionary approach. IUU fishing and insufficient control may have serious impacts on resources, environment, trade and local communities • Long-range transport of pollutants: the situation in 2020 is likely to be unchanged from 2006. Inputs of "old" hazardous substances are expected to decrease, but they are already dispersed and degradation is slow. Inputs of "new" hazardous substances are expected to increase. • Introduction of alien species: this is a serious threat, which will increases as tanker traffic increases. May result in substantial changes in ecosystems. • The greatest long-term challange is climate change.
Management plan • Report to the Parliament • Management of • Activities • Environment • Ecosystem functionality • Monitoring system • Goals and actions • Law enforcement is separate • Reporting system
Management plan Barents Sea • Developed 2002 – 2006 • Established 2006 • Important themes: • Identification of valuable ares • Area based framework for oil and gas aktivity • Indicator based monitoring • EcoQO’s for all ecosystem components • Organisation: • Management forum (NP) • Advisory group on monitoring (IMR) • Forum on environmental risk management (CA) Olsen et al. 2007, ICES JMS,
PARTICULAR VALUABLE AREAS • Important for biological production • Important for biodivesity • Based, among others, on: • Coexistence of oil-fish in the Norwegian and North Seas • Marine protected areas • Identification of particular valuable areas in the Lofoten –Barents Sea area Management Plan for The Norwegian Sea
New actions – coordination of monitoring To be done through ”Advisory group on monitoring of sea areas” • Broad membership from relevant public institutions • Coordinate the implementation of the monitoring system • Systematise and interpret the results based on the indicators, reference values and action thresholds to be used in the system
▶ Research and advisory programmes for the ecosystems • Establish knowledge as a basis for the management of the marine resources and environment in: • The Barents Sea • The Norwegian Sea • The North Sea • The coastal zone
G.O. SARS BUILT: 2003 4067 GRT. L.o.a: 77,5 M ▶ The research vessels Our most important tools for collecting data on the ecosystem JOHAN HJORT BUILT: 1990 1828 GRT. L.o.a: 64,4 M G.M. DANNEVIG BUILT: 1979 171 BGRT. L.o.a: 27,9 M HÅKON MOSBY BUILT: 1980 701 GRT., L.o.a: 47,2 M DR. FRIDTJOF NANSEN BUILT: 1993 1444 GRT. L.o.a: 56,8 M OWNER: NORAD
Ecological quality indicators EcoQO (Indicators, reference value and limits of action) • Ocean climate (3/2) • Ice edge (1/0) • Plant plankton (3/2) • Zoo plankton (2/3) • Fish stocks – non commercial (2/0) • Fish stocks – commercial (3/5) • Benthic organisms (3/1) • Sea birds and marine mammals (5/3-6) • Alien species (1/1) • Vulnerable / threatened species (1/1) • Pollution (4/17)
Operational monitoring • Map the extent of monitoring • Geographic - including vulnerable and valuable areas • Time - between and through years (time series) • Establish a system of evaluation of relevance and importance of existing monitoring • Relevance for management • Importance for quality of research • Consequences for health, environment and safety • Establish a common understanding of “Ecosystem based management” between institutions • Establish a system where institutions cooperate on monitoring planning • ”Loan” of competent personnel in monitoring • Arrange open conferences to ensure evaluation and feedback
Reports • Different types of reports • Status reports to the public • Status reports to the government • Assessment reports • Survey and field work reports • Internal / technical reports • Reporting systems • Internet / document portals • Scientific publications
Climate and acidification of the sea pH and carbonate concentration (global mean values) in surface ocean waters between 1800 and 2100. The values for 1800 are to close to those for pre-industrial conditions. Projected values are based on continued greenhouse gas emissions. The dotted lines show the projected levels in 2025
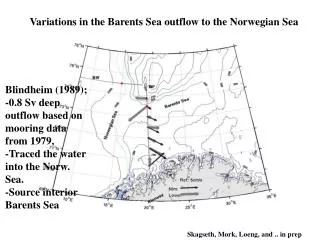
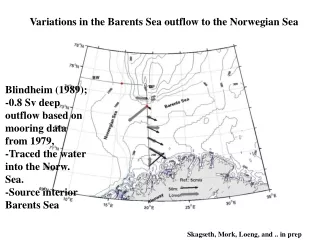
Climate change The temperature in the Barents Sea
Conflict of interests • Fishing, petroleum and shipping activities overlap in a corridor outside the territorial waters. Especially in: • Lofoten islands • Tromsø-bank • Coast of Finnmark • Less conflict potential offshore • Conflict with valuable areas
Knowledge development • “DG Ocean”…? • Social science in management • Sector based research institutes • Cross sector activities • Universities / academia • Project themes • Valuable and vulnerable areas • Baseline studies • Long time series
Scientific basis and knowledge gaps • There is a sound scientific basis for the management plan, but gaps in our knowledge have been identified and the following priority tasks identified: • Mapping of the bottom habitat • Studies of ecological interactions between species and components of the ecosystem (energy flow) • Studies of effects of pollutants • Measures to be introduced: • A better coordinated environmental monitoring system, to monitor the state of the ecosystem and environmental trends (indicators, reference values, action thresholds) • Expansion of research activity and surveys • Steps to fill gaps in our knowledge: activities under the Research Council of Norway
Seismic noise Range 7000 m
Oil droplets in water reduces feeding in cod larvae High concentration of oil droplets Control group (not exposed) Empty stomach Food in stomach Mortality rate used in risk analysis does not account for long term effects related to larval survival to adult fish.
Integrate all types of monitoring • Vision: i-Nord/Barentswatch shall become an international recognized and comprehensive dynamic surveillance system of the Arctic and Barents Sea related to safety, security, resources and environmental issues of the entire water column, sea ice-cover and lower atmosphere in a short and long term perspective.