Model Rejection Factor Plots
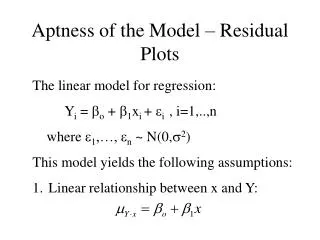
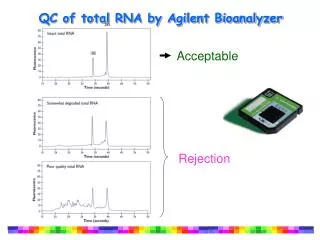
Model Rejection Factor Plots. Newt. This plot shows the Nhit distribution after quality cuts and zenith cut of 65 degrees with live time of 75 days. NHITS PLOT. MODEL REJECTION FACTOR. The lowest model rejection factor is 1.8 corresponding to livetime

Model Rejection Factor Plots
E N D
Presentation Transcript
This plot shows the Nhit distribution after quality cuts and zenith cut of 65 degrees with live time of 75 days. NHITS PLOT
MODEL REJECTION FACTOR The lowest model rejection factor is 1.8 corresponding to livetime of 75 days.As can be seen the background and signal have very little difference in slope.(they are almost parallel)
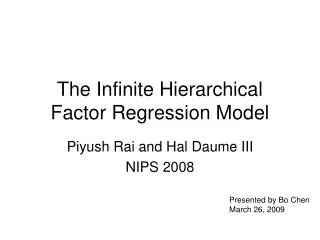
After three cuts on muon multiplicity the multiple muon background goes with same slope as single muons. 1)nearly(11)-nearly(2)=0 or –1.0 2)nearly(2)=0.0(only on strings 1-10) 3)jkrchi(2)<7.3(this parameter acts as quality cut till jkrchi(2)<7.8 and after that it is a cut on multiplicity. NHITS PLOT (AFTER MULTIPLICITY CUTS)
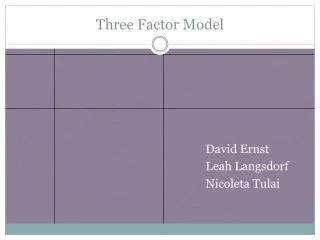
Model Rejection Factor (After multiplicity cuts) The lowest model rejection factor is 0.34 corresponding to livetime of 75 days.As can be seen signal starts to dominate background at higher Energies.The model rejection factor is reduced 5 fold after multiplicity cuts.
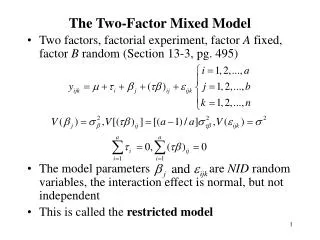
Extrapolation of MRF • The model rejection factor does depend on the total livetime of the M.C used so to see if there is an minimum in the MRF curve which could possible beat the sqrt(B.G)/signal I have simply extrapolated the spectra for a livetime of 20 years to see if there is a clear minima(plots in the following slide)
Model Rejection Factor(simulated) I have simply extrapolated the livetime to 20 years to See if I can find a minimum of MRF which is better than The sqrt(B.G)/signal and I don’t find one.