Download
1 / 18
180 likes | 342 Vues
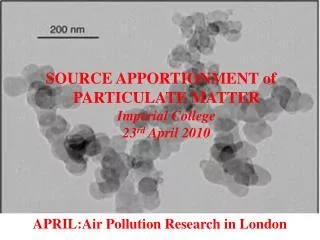
SOURCE APPORTIONMENT of PARTICULATE MATTER Imperial College 23 rd April 2010. APRIL:Air Pollution Research in London. Where from? nearest road other UK sources outside UK?. Which Sources? Emissions?. Concentration Exposure. What chemical composition? SO4,NO3,NH4, C, Fe etc.

E N D
SOURCE APPORTIONMENT of PARTICULATE MATTER Imperial College 23rd April 2010 APRIL:Air Pollution Research in London
Where from? nearest road other UK sources outside UK? Which Sources? Emissions? Concentration Exposure What chemical composition? SO4,NO3,NH4, C, Fe etc
SOURCE APPORTIONMENT of PM in INTEGRATED ASSESSMENT MODELLING at IMPERIAL COLLEGE Tim Oxley, Helen ApSimon, Ayman Elshkaki Imperial College London
PM modelling in UK IAM: uses data and work from several other modellers: aimed at predicting future concentrations and exposure Emissions Primary PM concentrations Secondary SIA (SO4, NO3 and NH4) concentrations Other contributions to PM10 & PM2.5 Trends 2010 to 2020
UK integrated assessment model, UKIAM Aim: Assess future scenarios and abatement measures in relation to setting of national emissions ceilings for 2020-> UK air quality, ecosystem protection and GHG emissions Pollutants: SO2, NOx, NH3, PM10, PM2.5, CO2, N2O, CH4 Detailed sub-model BRUTAL for road transport -> roadside concentrations + 1x1 km background concentrations Emissions UK sources based on NAEI (point or 1x1 km) Contributions imported from other countries and shipping
BRUTAL (UKIAM)-> modelling of urban air quality Road-side increment NOx, primary PM deep street canyons dense pop. city centre Open roads rural Emissions each UK road link NOx,PM,CO2,N2O (iMOVE) Traffic flow, ave speed, vehicle mix+ data base emission factors Superimpose on background concentration NOx, primary PM from UK sources Grid 1x1 km emissions road transport PPM model Other UK emissions Add long-range secondary PM: & primary NOx and PM contributions imported (including shipping) and from other sources Calculate NO2 concentrations from total NOx allowing for a frac.
EMISSIONS PRIMARY PM (UEP32 scenario) 2010 2020 (ktonnes) PM10 PM2.5 PM10 PM2.5 Power 4.5 3.0 4.1 2.7 Dom 16.4 9.9 14.1 8.5 Industry 42.9 24.6 43.6 24.9 Road Trans 25.5 20.1 15.5 12.4 Off-road 9.4 7.4 3.3 2.7 Agric/Nat. 15.7 6.7 15.7 6.7 ______________________________________________________________ Total UK 114.0 71.7 96.3 57.9 EU 27 (inc UK) 1964 1648 NB IIASA total PM2.5 agrees very well but sources covered differ ? Are there missing sources of PM e.g. from cooking
PRIMARY PM CONCENTRATIONS (PPM model) Small contributions imported and from shipping PM 2.5 in 2010 Sources (kt) UEP32 scenario Power 3.0 Domestic 9.9 Industry 24.6 Roads 20.1 Off-road 7.4 Agri/nat. 6.7 Total UK 71.7
PRECURSOR EMISSIONS Secondary Inorganic Aerosol kt 2010 2020 UEP32 scenario SO2 NOx SO2 NOx Power 138 296 71 144 Domestic 16 93 9 67 Industry 181 229 167 223 Roads 0.6 339 0.6 124 Off-road 11 153 12 73 ___________________________________________________ Total UK 346 1110 259 632 EU27 5928 8749 4424 6339 UK NH3 307kt in both 2010 and 2020 (IPPC not included) EU27 NH3 4212 kt in 2010 and 4124 in 2020
CONCENTRATIONS OF SIA= SO4+NO3+NH4 FRAME and EMEP models- UKIAM : use of pre-calculated source-receptor footprints each source->rapid scenario assessment Take reference case and estimate effect of reducing emissions from a source by specified amount on concentrations/deposition-> multiply effect for bigger/smaller changes in emission More complicated for secondary PM with interacting pollutants- e.g. need to allow for effect of NH3 on NO3 concentrations.
SIA components in 2020; based on FRAME/EMEP models Frame NH4 SO4 NO3 total PWM 0.74 mg/m3 0.82 fine 1.46 3.0 (PM2.5) all 1.71 3.24 (PM10) EMEP implies larger proportion imported than FRAME-> total SIA 4.5 mg/m3
OTHER CONTRIBUTIONS PWC PM10 PM2.5 Ca dust * 1.6 .47 Fe (inc re-* Suspension) 1.59 .63 Sea salt * 2.46 .66 SOA (HARM Model) .87 .65 Water 1.36 1.36 _____________________________ Total 7.9 3.8 * based on maps from AEA (JS)
Total PM10 in 2010 Total PM2.5 in 2010
Source Apportionment PM10 in 2010 (UEP32 scenario) NB popn. weighted 1x1 km background concentrations
Source Apportionment Scenario UEP32 PM10 (2010) PM10 (2020) NO2 (2020)
2010 ROADSIDE SITES 2020 Local road 0ther roads Non-road primary Euro SIA UK SIA Ship PM Import PM Other 30.1 mg/m3 23.4mg/m3 M. Road M. Road 18.9 mg/m3 22.3 mg/m3 Southampton Southampton
Roads “at risk” of exceeding AQ limit value (ann. ave. PM10 > 31.5 mg/m3) km UK London 157 34 2020 14 2 NB background higher over east UK (high Ca dust) -> exceedance outside London
Some comments Modelled primary PM reduces with exhaust fraction becoming negligible, and road transport small (tyres and brakes) but are there sources missing from inventory? SIA- also reduces with up to half imported from Europe and dependent on other countries reductions but uncertainties Other components SOA, dust etc add up to as much or more than primary and SIA for PM10, and are also a significant addition to PM2.5-> more work needed on these. In future: Move towards a speciated PM inventory re toxic components, black C etc