Download
1 / 20
200 likes | 229 Vues
Explore marine chemistry and environmental science using real-time data to study the effects of agriculture on estuarine waterways. Dive into trends, challenges, and solutions impacting coastal ecosystems.

E N D
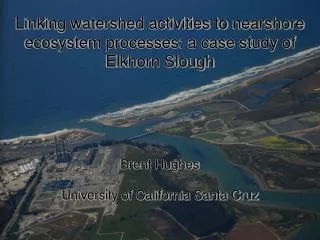
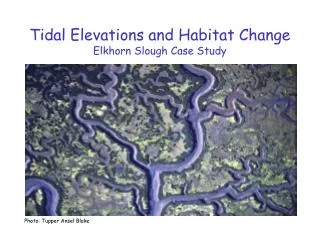
Nitrate Levels in Elkhorn Slough John, Esat, Crystal
Summary This activity uses realtime data from the Ocean Observatory LOBO to introduce students to marine chemistry, environmental science and oceanography. Using this multidisciplinary approach, students will investigate their own questions about how agriculture and coastal processes affect estuarine waterways.
Key Concepts • Technology enables scientists to study changes in water chemistry and see short and long-term trends. • Scientists use technology to help answer questions about the affect of human activities on waterways. • Small changes in the chemical concentration of contaminants may cause drastic changes in the ecosystem
Recommended Background Knowledge • Understanding of tidal cycles. • Ability to read and interpret graphs. • Have been introduced to estuarine ecosystems • General understanding of metric system • General understanding of concentration
Objectives • Students will be able to: • Interpret data and apply to multiple disciplines. • Understand how scientists use realtime data to understand the properties of water. • Use data from the LOBO observatory to discover changes in the properties of brackish water. • Discover how human activities affect coastal waterways. • Understand how underwater observatories are changing the way scientists work.
Materials • Computers with Internet access or teacher PC with LCD projector and printouts of appropriate information
Procedure • Engage students in a class discussion, considering the following questions: • What factors cause changes in estuarine salinity? • What are the possible sources of pollutants in estuarine waterways? • How does agriculture affect ocean chemistry? • What is eutrophication?
Have students generate (or in the absence of computers, distribute hard copy and/or show on overhead) the graph of salinity and nitrate concentration versus time.
Discussion: As a class or in small groups • Is there a correlation between the two graphs? • Is so, describe the correlation and determine if they are related or is it coincidence?
Discussion • What is the cause of the fluctuation? (tidal cycle). • Find (teacher distribute) tidal cycle data and superimpose a graph (draw) of the local tidal cycle and compare with salinity and nitrate graphs. Which other characteristics of the water are correlated? If so, which ones? Graph shows delayed correlation. The concentration of seawater salts will correlate
Discussion • Find the normal level of nitrates in seawater. (10 mM) • Is seawater the source of the nitrate levels found in Elkhorn Slough? No • Are there other possible sources of nitrates into the slough? Yes
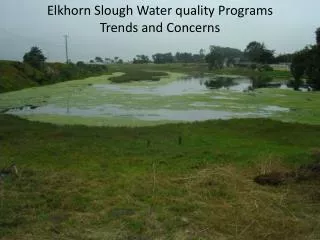
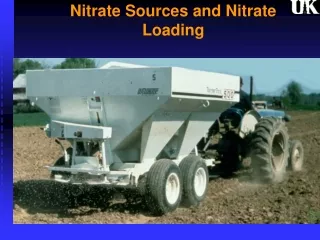
Discussion • What other environmental sources of nitrates exist in this watershed area? (Teacher will need to provide or students will need to find maps showing nearby agriculture and development.)
Discussion • Drainage from agricultural areas has been blamed for surface and groundwater contamination and eutrophication of bodies of water, mostly freshwater lakes and streams. After looking at the maps, what are the possible sources of the nitrate contamination. What would you do to prove your hypothesis? Salinas River. Place a measuring station/observatory at the mouth of the river
Discussion Describe other factors that may affect the slough’s chemistry. What do we do about it? What is mitigation? As a class, discuss the importance of the environment and human impact on sensitive ecosystems like Elkhorn Slough. Why is it important to protect these areas? Can what we learned from the Elkhorn Slough example be applied elsewhere?
Discussion Discuss the role of fertilizers have in agriculture. Can we eliminate or reduce the level of fertilizers used? What other issues in public policy are related to this topic?
After the class discussion, have students write an essay on one of the previous topics.
Assessment • Performance—Did student participate in discussion and Web investigation sessions and demonstrate an understanding of how observatories work? • Product—Did student correctly address the discussion questions? Does the student’s essay reflect an understanding of this example of an estuarine ecosystem