Download

1 / 26
260 likes | 280 Vues
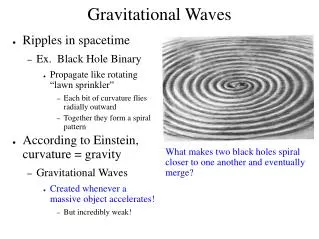
Measuring gravitational waves with GEO600. Martin Hewitson and the GEO team. Overview. h(t). GEO. v(t) [V]. Noise e.g., seismic, laser. calibrate. 1 GEO. v(t) [V]. h(t) + noise. P(t) [V]. filter. Inside the GEO box. h(t) detected. h(t). Optical cavity. +. v(t) [V]. Seismic

E N D
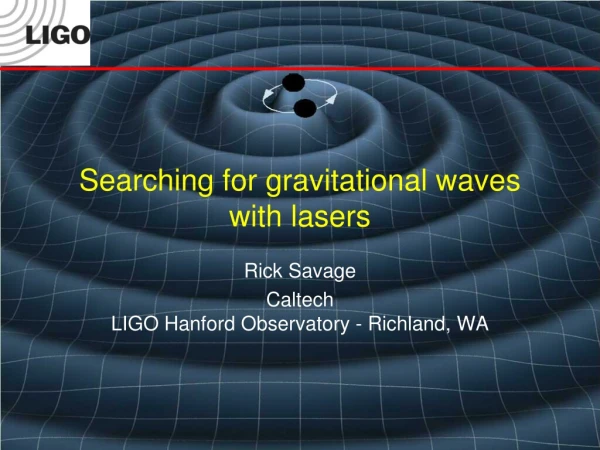
Measuring gravitational waves with GEO600 Martin Hewitson and the GEO team
Overview h(t) GEO v(t) [V] Noise e.g., seismic, laser calibrate 1 GEO v(t) [V] h(t) + noise R&D Hannover July 2004
P(t) [V] filter Inside the GEO box h(t) detected h(t) Optical cavity + v(t) [V] Seismic noise Keep detector at its operating point (dark fringe) R&D Hannover July 2004
In the steady state…. R&D Hannover July 2004
Optical transfer function R&D Hannover July 2004
Optical transfer function - equations • For each quadrature, P and Q, • Overall gain • Pole frequency • Pole Q • Zero frequency R&D Hannover July 2004
Measured optical response - P R&D Hannover July 2004
Measured optical response - Q R&D Hannover July 2004
calibration Calibration overview R&D Hannover July 2004
Calibration software tasks R&D Hannover July 2004
On-line measurement of optical TF R&D Hannover July 2004
Optimisation routine • Fit models of the optical transfer functions to the measured ones • 8 parameter fit • Gp, Ppf, Ppq, Pzf, Gq, Qpf, Qpq, Qzf • Algorithm uses various minimisation methods to find the best parameter set that describes the data • It also returns a measure of success – c2 R&D Hannover July 2004
Undoing the effect of the optical response • The parameters from sys id can be used to generate inverse optical response • Poles to zeros, zeros to poles, invert gains • IIR filters are designed for these inverted responses • Overall gains are treated separately • Filters are applied to up-sampled error-point to give better filter response R&D Hannover July 2004
Generating loop-gain correction signals • A full set of IIR filters has be constructed to match the response of the feedback electronics in the detection band • One set for fast feedback, one set for slow feedback • Error-point signal is filtered through these electronics filters and then through actuator filters • This produces two ‘displacement’ signals that correct for the loop gain of the MI servo R&D Hannover July 2004
Calibration pipeline R&D Hannover July 2004
S3 II recovered parameters R&D Hannover July 2004
Pros and cons • Pros • Calibration is updated once per second • Accuracy to ~10% from 50Hz to 6kHz • Runs on-line with 2 min latency – time-domain! • Produces calibrated time-series – h(t) • Cons • Fast (>1Hz) optical gain fluctuations ignored • Outwith valid frequency range, accuracy is poorer • Bottom line is ESD calibration – good to about 5% • Need independent check of ESD • Photon pressure calibrator R&D Hannover July 2004
c2 behaviour • The measure of success from the optimisation routine tells us something about data quality • c2 also depends on SNR of calibration lines in P R&D Hannover July 2004
Quality channel • Is one 16-bit sample per second • Encodes information from • Lock status • Maintenance status • c2 threshold crossings • So far, c2 thresholds have been chosen arbitrarily R&D Hannover July 2004
Calibration simulations • Simulations done for only open-loop detector • Red signals are output to frame files • Normal calibration code is run on these frames R&D Hannover July 2004
Simulation results - c2 v SNR R&D Hannover July 2004
Parameter recovery – SNR = 100 c2 R&D Hannover July 2004
Measured c2 behaviour R&D Hannover July 2004
Measured c2 behaviour R&D Hannover July 2004
Measured c2 behaviour noise estimation (s2) R&D Hannover July 2004
Current and future work • Q quadrature parameters are now successfully estimated • Something not fully understood about Q response • Makes unstable IIR filter • More studies of c2 values for P+Q simulations • More studies of c2 values for P+Q ‘real’ data • How to combine h(t)_P and h(t)_Q ? R&D Hannover July 2004