Avoid Data Extrapolation: Cautions, Outliers, and Correlations
160 likes | 187 Vues
This section explores the dangers of extrapolation, the impact of outliers in correlation analysis, and how lurking variables can confound associations. Learn how influential outliers can skew regression outcomes and why correlation does not imply causation. Understand Simpson's Paradox and its implications in data analysis.

Avoid Data Extrapolation: Cautions, Outliers, and Correlations
E N D
Presentation Transcript
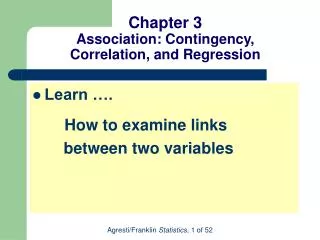
Chapter 3Association: Contingency, Correlation, and Regression Section 3.4 Cautions in Analyzing Associations
Extrapolation Is Dangerous • Extrapolation: Using a regression line to predict y-values for x-values outside the observed range of the data. • Riskier the farther we move from the range of the given x-values. • There is no guarantee that the relationship given by the regression equation holds outside the range of sampled x-values.
Be Cautious of Influential Outliers • One reason to plot the data before you do a correlation or regression analysis is to check for unusual observations. • Search for observations that are regression outliers, being well removed from the trend that the rest of the data follow.
Outliers and Influential Points • A regressionoutlier is an observation that lies far away from the trend that the rest of the data follows. • An observation is influential if • its x value is relatively low or high compared to the remainder of the data. • the observation is a regression outlier. • Influential observations tend to pull the regression line • toward that data point and away from the rest of the • data points.
Outliers and Influential Points Figure 3.18 An Observation Is a Regression Outlier if it is Far Removed from the Trend that the Rest of the Data Follow. The top two points are regression outliers. Not all regression outliers are influential in affecting the correlation or slope. Question: Which regression outlier in this figure is influential?
Correlation Does Not Imply Causation • In a regression analysis, suppose that as x goes up, y also tends to go up (or down). Can we conclude that there’s a causal connection, with changes in x causing changes in y? • A strong correlation between x and y means that there is a strong linear association that exists between the two variables. • A strong correlation between x and y, does not mean that xcausesy to change.
Correlation Does Not Imply Causation • Data are available for all fires in Chicago last year on x = number of • firefighters at the fire and y = cost of damages due to the fire. 1. Would you expect the correlation to be negative, zero, or positive? 2. If the correlation is positive, does this mean that having more firefighters at a fire causes the damages to be worse? Yes or No? 3. Identify a third variable that could be considered a common cause of x and y: • Distance from the fire station • Intensity of the fire • Size of the fire
Lurking Variables & Confounding • A lurking variable is a variable, usually unobserved, that influences the association between the variables of primary interest. • Ice cream sales and drowning – lurking variable = temperature • Reading level and shoe size – lurking variable = age • Childhood obesity rate and GDP-lurking variable = time • When two explanatory variables are both associated with a response variable but are also associated with each other, there is said to be confounding. • Lurking variables are not measured in the study but have the potential for confounding.
Simpson’s Paradox • Simpson’s Paradox: • When the direction of an association between two variables changes after we include a third variable and analyze the data at separate levels of that third variable.
Simpson’s Paradox Example: Smoking and Health Is Smoking Actually Beneficial to Your Health? Table 3.7 Smoking Status and 20-Year Survival in Women Probability of Death of Smoker = 139/582= 24% Probability of Death of Nonsmoker = 230/732= 31% This can’t be true that smoking improves your chances of living! What’s going on?!
Simpson’s Paradox Example: Smoking and Health Break out Data by Age Table 3.8 Smoking Status and 20-Year Survival, for Four Age Groups
Simpson’s Paradox Example: Smoking and Health For instance, for smokers of age 18–34, from Table 3.8 the proportion who died was 5/(5 + 174) = 0.028, or 2.8% Could age explain the association? Table 3.9 Conditional Percentages of Deaths for Smokers and Nonsmokers, by Age
Simpson’s Paradox Example: Smoking and Health Figure 3.23 MINITAB Bar Graph Comparing Percentage of Deaths for Smokers and Nonsmokers, by Age. This side-by-side bar graph shows the conditional percentages from Table 3.9. An association can look quite different after adjusting for the effect of a third variable by grouping the data according to the values of the third variable (age).
The Effect of Lurking Variables on Associations Lurking variables can affect associations in many ways. For instance, a lurking variable may be a common cause of both the explanatory and response variable. In practice, there’s usually not a single variable that causally explains a response variable or the association between two variables. More commonly, there are multiple causes . When there are multiple causes, the association among them makes it difficult to study the effect of any single variable.
The Effect of Confounding on Associations When two explanatory variables are both associated with a response variable but are also associated with each other, confounding occurs. It is difficult to determine whether either of them truly causes the response because a variable’s effect could be at least partly due to its association with the other variable.