Chapter 3 Association: Contingency, Correlation, and Regression
Chapter 3 Association: Contingency, Correlation, and Regression. Section 3.1 How Can We Explore the Association between Two Categorical Variables?. Learning Objectives. Identify variable type: Response or Explanatory Define Association Contingency tables

Chapter 3 Association: Contingency, Correlation, and Regression
E N D
Presentation Transcript
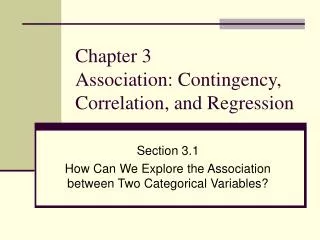
Chapter 3Association: Contingency, Correlation, and Regression Section 3.1 How Can We Explore the Association between Two Categorical Variables?
Learning Objectives • Identify variable type: Response or Explanatory • Define Association • Contingency tables • Calculate proportions and conditional proportions
Learning Objective 1:Response and Explanatory variables • Response variable (Dependent Variable) the outcome variable on which comparisons are made • Explanatory variable (Independent variable) defines the groups to be compared with respect to values on the response variable • Example: Response/Explanatory • Blood alcohol level/# of beers consumed • Grade on test/Amount of study time • Yield of corn per bushel/Amount of rainfall
Learning Objective 2:Association • The main purpose of data analysis with two variables is to investigate whether there is an association and to describe that association • An association exists between two variables if a particular value for one variable is more likely to occur with certain values of the other variable
Learning Objective 3:Contingency Table • A contingency table: • Displays two categorical variables • The rows list the categories of one variable • The columns list the categories of the other variable • Entries in the table are frequencies
Learning Objective 3:Contingency Table What is the response variable? What is the explanatory variable?
Learning Objective 4:Calculate proportions and conditional proportions
Learning Objective 4: Calculate proportions and conditional proportions • What proportion of organic foods contain pesticides? • What proportion of conventionally grown foods contain pesticides? • What proportion of all sampled items contain pesticide residuals?
Learning Objective 4:Calculate proportions and conditional proportions Use side by side bar charts to show conditional proportions Allows for easy comparison of the explanatory variable with respect to the response variable
Learning Objective 4:Calculate proportions and conditional proportions • If there was no association between organic and conventional foods, then the proportions for the response variable categories would be the same for each food type
Chapter 3Association: Contingency, Correlation, and Regression Section 3.2 How Can We Explore the Association between Two Quantitative Variables?
Learning Objectives: • Constructing scatterplots • Interpreting a scatterplot • Correlation • Calculating correlation
Learning Objective 1:Scatterplot • Graphical display of relationship between two quantitative variables: • Horizontal Axis: Explanatory variable, x • Vertical Axis: Response variable, y
Learning Objective 1:Internet Usage and Gross National Product (GDP) Data Set
Learning Objective 1:Internet Usage and Gross National Product (GDP) • Enter values of explanatory variable (x) in L1 • Enter values of of response variable (y) in L2 • STAT PLOT • Plot 1 on • Type: scatter plot • X list: L2 • Y list: L1 • ZOOM • 9:ZoomStat • Graph
Learning Objective 1:Baseball Average and Team Scoring • Enter values of explanatory variable (x) in L1 • Enter values of of response variable (y) in L2 • STAT PLOT • Plot 1 on • Type: scatter plot • X list: L1 • Y list: L2 • ZOOM • 9:ZoomStat • Graph Use L3 for x and L4 for y. You will use data from prior example again later on in the PowerPoint.
Learning Objective 2:Interpreting Scatterplots • You can describe the overall pattern of a scatterplot by the trend, direction, and strength of the relationship between the two variables • Trend: linear, curved, clusters, no pattern • Direction: positive, negative, no direction • Strength: how closely the points fit the trend • Also look for outliers from the overall trend
Learning Objective 2:Interpreting Scatterplots: Direction/Association • Two quantitative variables x and y are • Positively associated when • High values of x tend to occur with high values of y • Low values of x tend to occur with low values of y • Negatively associatedwhen high values of one variable tend to pair with low values of the other variable
Learning Objective 2:Example: 100 cars on the lot of a used-car dealership Would you expect a positive association, a negative association or no association between the age of the car and the mileage on the odometer? • Positive association • Negative association • No association
Learning Objective 2:Example: Did the Butterfly Ballot Cost Al Gore the 2000 Presidential Election?
Learning Objective 3:Linear Correlation, r • Measures the strength and direction of the linear association between x and y • A positive r value indicates a positive association • A negative r value indicates a negative association • An r value close to +1 or -1 indicates a strong linear association • An r value close to 0 indicates a weak association
Learning Objective 3:Correlation coefficient: Measuring Strength & Direction of a Linear Relationship
Learning Objective 3:Properties of Correlation • Always falls between -1 and +1 • Sign of correlation denotes direction • (-) indicates negative linear association • (+) indicates positive linear association • Correlation has a unitless measure - does not depend on the variables’ units • Two variables have the same correlation no matter which is treated as the response variable • Correlation is not resistant to outliers • Correlation only measures strength of linear relationship
Leaning Objective 4:Calculating the Correlation Coefficient Per Capita Gross Domestic Product and Average Life Expectancy for Countries in Western Europe
Learning Objective 4:Calculating the Correlation Coefficient
STAT CALC menu Choose 8: LinReg(a+bx) 1st number = x variable 2nd number = y variable Enter Learning Objective 4:Internet Usage and Gross National Product (GDP) Correlation = .889
Enter x data into L1 Enter y data into L2 STAT CALC memu Choose 8: LinReg(a+bx) 1st number = x variable 2nd number = y variable Enter Learning Objective 4:Baseball Average and Team Scoring Correlation = .874
Chapter 3Association: Contingency, Correlation, and Regression Section 3.3 How Can We Predict the Outcome of a Variable?
Learning Objectives • Definition of a regression line • Use a regression equation for prediction • Interpret the slope and y-intercept of a regression line • Identify the least-squares regression line as the one that minimizes the sum of squared residuals • Calculate the least-squares regression line
Learning Objectives • Compare roles of explanatory and response variables in correlation and regression • Calculate r2 and interpret
Learning Objective 1:Regression Analysis • The first step of a regression analysis is to identify the response and explanatory variables • We use y to denote the response variable • We use x to denote the explanatory variable
Learning Objective 1:Regression Line • A regression line is a straight line that describes how the response variable (y) changes as the explanatory variable (x) changes • A regression line predicts the value of the response variable (y) for a given level of the explanatory variable (x) • The y-intercept of the regression line is denoted by a • The slope of the regression line is denoted by b
Learning Objective 2:Example: How Can Anthropologists Predict Height Using Human Remains? • Regression Equation: • is the predicted height and is the length of a femur (thighbone), measured in centimeters • Use the regression equation to predict the height of a person whose femur length was 50 centimeters
Learning Objective 3:Interpreting the y-Intercept • y-Intercept: • The predicted value for y when x = 0 • Helps in plotting the line • May not have any interpretative value if no observations had x values near 0
Learning Objective 3:Interpreting the Slope • Slope: measures the change in the predicted variable (y) for a 1 unit increase in the explanatory variable in (x) • Example: A 1 cm increase in femur length results in a 2.4 cm increase in predicted height
Learning Objective 3:Slope Values: Positive, Negative, Equal to 0
Learning Objective 3:Regression Line • At a given value of x, the equation: • Predicts a single value of the response variable • But… we should not expect all subjects at that value of x to have the same value of y • Variability occurs in the y values!
Learning Objective 3:The Regression Line • The regression line connects the estimated means of y at the various x values • In summary, Describes the relationship between x and the estimated means of y at the various values of x
Learning Objective 4:Residuals • Measures the size of the prediction errors, the vertical distance between the point and the regression line • Each observation has a residual • Calculation for each residual: • A large residual indicates an unusual observation
Learning Objective 4:“Least Squares Method” Yields the Regression Line • Residual sum of squares: • The least squares regression line is the line that minimizes the vertical distance between the points and their predictions, i.e., it minimizes the residual sum of squares • Note: the sum of the residuals about the regression line will always be zero
Learning Objective 5:Regression Formulas for y-Intercept and Slope • Slope: • Y-Intercept: Regression line always passes through
Learning Objective 5:Calculating the slope and y intercept for the regression line Slope =26.4 y intercept=-2.28
Learning Objective 5:Internet Usage and Gross National Product (GDP)
Enter x data into L1 Enter y data into L2 STAT CALC menu Choose 8: LinReg(a+bx) 1st number = x variable 2nd number = y variable Enter Learning Objective 5:Internet Usage and Gross National Product =1.548x-3.63
Enter x data into L1 Enter y data into L2 STAT CALC Choose 8: LinReg(a+bx) 1st number = x variable 2nd number = y variable Enter Learning Objective 5:Baseball average and Team Scoring
Learning Objective 6:The Slope and the Correlation • Correlation: • Describes the strength of the linear association between 2 variables • Does not change when the units of measurement change • Does not depend upon which variable is the response and which is the explanatory