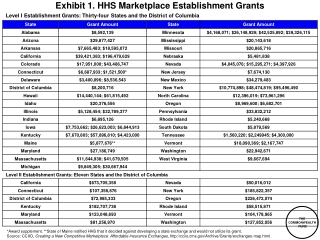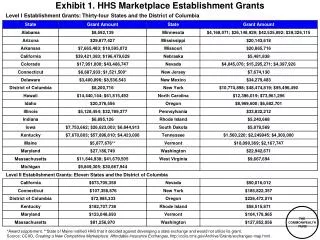
EXHIBIT 1
240 likes | 421 Vues
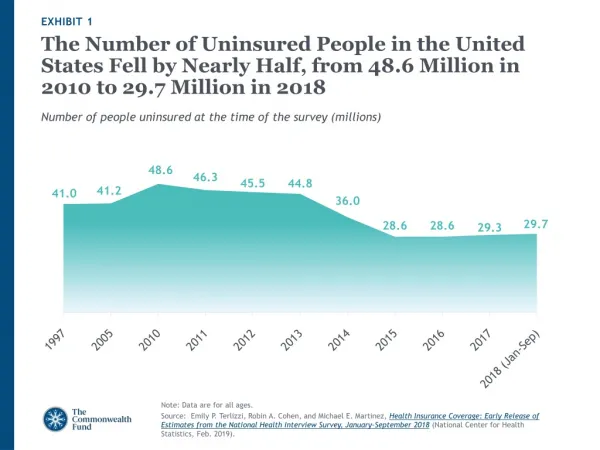
EXHIBIT 1. The Number of Uninsured People in the United States Fell by Nearly Half, from 48.6 Million in 2010 to 29.7 Million in 2018. Number of people uninsured at the time of the survey (millions). Note: Data are for all ages.

EXHIBIT 1
E N D
Presentation Transcript
EXHIBIT 1 The Number of Uninsured People in the United States Fell by Nearly Half, from 48.6 Million in 2010 to 29.7 Million in 2018 Number of people uninsured at the time of the survey (millions) Note: Data are for all ages. Source: Emily P. Terlizzi, Robin A. Cohen, and Michael E. Martinez, Health Insurance Coverage: Early Release of Estimates from the National Health Interview Survey, January–September 2018 (National Center for Health Statistics, Feb. 2019).
EXHIBIT 2 Fewer Adults Report Not Getting Needed Care Because of Costs, but Gains Have Stalled in Recent Years • Percent of adults ages 19–64 who reported any of the following cost-related access problems in the past year: • Had a medical problem but did not visit doctor or clinic • Did not fill a prescription • Skipped recommended test, treatment, or follow-up • Did not get needed specialist care Data: Commonwealth Fund Biennial Health Insurance Surveys (2003, 2005, 2010, 2012, 2014, 2016, 2018). Source: Sara R. Collins, Herman K. Bhupal, and Michelle M. Doty, Health Insurance Coverage Eight Years After the ACA: Fewer Uninsured Americans and Shorter Coverage Gaps, But More Underinsured — Findings from the Commonwealth Fund Biennial Health Insurance Survey, 2018 (Commonwealth Fund, Feb. 2019).
EXHIBIT 3 Fewer Adults Have Difficulty Paying Their Medical Bills, but the Improvement Has Stalled • Percent of adults ages 19–64 who reported any of the following medical bill or debt problems in the past year: • Had problems paying or unable to pay medical bills • Contacted by a collection agency for unpaid medical bills • Had to change way of life to pay bills • Medical bills/debt being paid off over time Data: Commonwealth Fund Biennial Health Insurance Surveys (2005, 2010, 2012, 2014, 2016, 2018). Source: Sara R. Collins, Herman K. Bhupal, and Michelle M. Doty, Health Insurance Coverage Eight Years After the ACA: Fewer Uninsured Americans and Shorter Coverage Gaps, But More Underinsured — Findings from the Commonwealth Fund Biennial Health Insurance Survey, 2018 (Commonwealth Fund, Feb. 2019).
EXHIBIT 4 Since the ACA, Gaps in People’s Coverage Have Been Shorter Percent of adults ages 19–64 insured now but had a coverage gap in past year Data: Commonwealth Fund Biennial Health Insurance Surveys (2001, 2010, 2012, 2014, 2016, 2018). Source: Sara R. Collins, Herman K. Bhupal, and Michelle M. Doty, Health Insurance Coverage Eight Years After the ACA: Fewer Uninsured Americans and Shorter Coverage Gaps, But More Underinsured — Findings from the Commonwealth Fund Biennial Health Insurance Survey, 2018 (Commonwealth Fund, Feb. 2019).
EXHIBIT 5 The Uninsured Rate Increased in 14 States from 2016 to 2017; Not All Were Medicaid Nonexpansion States Change in uninsured rate, 2016–2017 No change Decrease Increase Not expanding Medicaid* * Medicaid expansion status as of January 1, 2017. Source: Edward R. Berchick, Emily Hood, and Jessica C. Barnett, Health Insurance Coverage in the United States: 2017 (U.S. Census Bureau, Sept. 2018).
EXHIBIT 6 Uninsured Rates Have Fallen in Response to Coverage Expansions, but Gains Have Flattened Percent of individuals without health insurance*, 1997–2018 Children’s Health Insurance Program (CHIP), 1997 ACA major coverage expansions, 2014 ACA passed, 2010 * At the time of interview. ** 2018 data are for January–September. Source: Emily P. Terlizzi, Robin A. Cohen, and Michael E. Martinez, Health Insurance Coverage: Early Release of Estimates from the National Health Interview Survey, January–September 2018 (National Center for Health Statistics, Feb. 2019).
EXHIBIT 7 Status of Medicaid Expansion Across the States Ballot initiative to expand Medicaid passed, state has not yet expanded (3 states) Expanded (26 states + D.C.) 1115 expansion waiver (7 states) Not yet expanded (14 states) Note: Adults in Wisconsin and Utah are eligible for Medicaid up to 100% of federal poverty level. Last updated: April 9, 2019.
EXHIBIT 8 Inadequate Coverage Is Associated with More Cost-Related Problems Getting Needed Care Percent of adults ages 19–64 who had any of four access problems in past year because of cost* Notes: * Includes any of the following because of cost: did not fill a prescription; skipped recommended medical test, treatment, or follow-up; had a medical problem but did not visit doctor or clinic; did not see a specialist when needed. “Underinsured” refers to adults who were insured all year but experienced one of the following: out-of-pocket costs, excluding premiums, equaled 10% or more of income; out-of-pocket costs, excluding premiums, equaled 5% or more of income if low-income (<200% of poverty); or deductibles equaled 5% or more of income. “Insured now, had a coverage gap” refers to adults who were insured at the time of the survey but were uninsured at any point in the 12 months prior to the survey field date. “Uninsured now” refers to adults who reported being uninsured at the time of the survey. Data: Commonwealth Fund Biennial Health Insurance Surveys (2018). Source: Sara R. Collins, Herman K. Bhupal, and Michelle M. Doty, Health Insurance Coverage Eight Years After the ACA: Fewer Uninsured Americans and Shorter Coverage Gaps, But More Underinsured — Findings from the Commonwealth Fund Biennial Health Insurance Survey, 2018 (Commonwealth Fund, Feb. 2019).
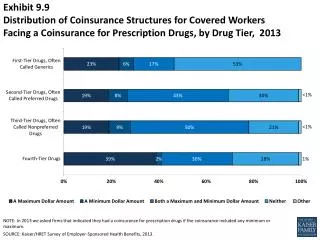
EXHIBIT 9 Inadequate Coverage Is Associated with More Problems Paying Medical Bills Percent of adults ages 19–64 who had medical bill or debt problems in past year* Notes: * Includes any of the following: had problems paying or unable to pay medical bills; contacted by collection agency for unpaid medical bills; had to change way of life to pay bills; medical bills/debt being paid over time. “Underinsured” refers to adults who were insured all year but experienced one of the following: out-of-pocket costs, excluding premiums, equaled 10% or more of income; out-of-pocket costs, excluding premiums, equaled 5% or more of income if low-income (<200% of poverty); or deductibles equaled 5% or more of income. “Insured now, had a coverage gap” refers to adults who were insured at the time of the survey but were uninsured at any point in the 12 months prior to the survey field date. “Uninsured now” refers to adults who reported being uninsured at the time of the survey. Data: Commonwealth Fund Biennial Health Insurance Surveys (2018). Source: Sara R. Collins, Herman K. Bhupal, and Michelle M. Doty, Health Insurance Coverage Eight Years After the ACA: Fewer Uninsured Americans and Shorter Coverage Gaps, But More Underinsured — Findings from the Commonwealth Fund Biennial Health Insurance Survey, 2018 (Commonwealth Fund, Feb. 2019).
EXHIBIT 10 Continuously Insured Adults Are More Likely to Get Preventive Care Percent of adults ages 19–64 Notes: “Continuously insured” refers to adults who were insured for the full year up to and on the survey field date. “Underinsured” refers to adults who were insured all year but experienced one of the following: out-of-pocket costs, excluding premiums, equaled 10% or more of income; out-of-pocket costs, excluding premiums, equaled 5% or more of income if low-income (<200% of poverty); or deductibles equaled 5% or more of income. “Insured now, had a coverage gap” refers to adults who were insured at the time of the survey but were uninsured at any point in the 12 months prior to the survey field date. “Uninsured now” refers to adults who reported being uninsured at the time of the survey. Respondents were asked if they: had their blood pressure checked within the past two years (in past year if has hypertension or high blood pressure); had their cholesterol checked in past five years (in past year if has hypertension, heart disease, or high cholesterol); and had their seasonal flu shot within the past 12 months. Data: Commonwealth Fund Biennial Health Insurance Surveys (2018). Source: Sara R. Collins, Herman K. Bhupal, and Michelle M. Doty, Health Insurance Coverage Eight Years After the ACA: Fewer Uninsured Americans and Shorter Coverage Gaps, But More Underinsured — Findings from the Commonwealth Fund Biennial Health Insurance Survey, 2018 (Commonwealth Fund, Feb. 2019).
EXHIBIT 11 Continuously Insured Adults Are More Likely to Get Cancer Screenings Percent of adults ages 19–64 Notes: “Continuously insured” refers to adults who were insured for the full year up to and on the survey field date. “Underinsured” refers to adults who were insured all year but experienced one of the following: out-of-pocket costs, excluding premiums, equaled 10% or more of income; out-of-pocket costs, excluding premiums, equaled 5% or more of income if low-income (<200% of poverty); or deductibles equaled 5% or more of income. “Insured now, had a coverage gap” refers to adults who were insured at the time of the survey but were uninsured at any point in the 12 months prior to the survey field date. “Uninsured now” refers to adults who reported being uninsured at the time of the survey. Respondents were asked if they: received a Pap test within the past three years for females ages 21–64, received a mammogram within the past two years for females ages 40–64, and received a colon cancer screening within the past five years for adults ages 50–64. Data: Commonwealth Fund Biennial Health Insurance Surveys (2018). Source: Sara R. Collins, Herman K. Bhupal, and Michelle M. Doty, Health Insurance Coverage Eight Years After the ACA: Fewer Uninsured Americans and Shorter Coverage Gaps, But More Underinsured — Findings from the Commonwealth Fund Biennial Health Insurance Survey, 2018 (Commonwealth Fund, Feb. 2019).
EXHIBIT 12 More Adults Are Underinsured, with the Greatest Growth Occurring Among Those with Employer Coverage Percent of adults ages 19–64 insured all year who were underinsured Notes: “Underinsured” refers to adults who were insured all year but experienced one of the following: out-of-pocket costs, excluding premiums, equaled 10% or more of income; out-of-pocket costs, excluding premiums, equaled 5% or more of income if low-income (<200% of poverty); or deductibles equaled 5% or more of income. Total includes adults with coverage through Medicaid and Medicare. Respondents may have had another type of coverage at some point during the year, but had coverage for the entire previous 12 months. ^ For 2014 and 2016, includes those who get their individual coverage through the marketplace and outside of the marketplace. Data: Commonwealth Fund Biennial Health Insurance Surveys (2003, 2005, 2010, 2012, 2014, 2016, 2018). Source: Sara R. Collins, Herman K. Bhupal, and Michelle M. Doty, Health Insurance Coverage Eight Years After the ACA: Fewer Uninsured Americans and Shorter Coverage Gaps, But More Underinsured (Commonwealth Fund, Feb. 2019).
EXHIBIT 13 One-Third of Adults with Employer Coverage Say They Would Not Have the Money to Pay an Unexpected $1,000 Medical Bill Within 30 Days If you were to experience an unexpected medical event in 2018 that left you with a bill for $1,000, would you have the money to pay the bill within 30 days? Percent of adults ages 19–64 with employer coverage who responded “no” Data: Commonwealth Fund Affordable Care Act Tracking Survey, Feb.–Mar. 2018.
EXHIBIT 14 Adults with Medical Bill Problems Had Lingering Financial Problems Under 200% FPL Total 200% FPL or more Percent adults ages 19–64 who reported the following happened in the past two years because of medical bill problems^ ^ Base: Respondents who reported at least one of the following medical bill problems in the past 12 months: had problems paying medical bills, contacted by a collection agency for unpaid bills, had to change way of life in order to pay medical bills, or has outstanding medical debt. Data: Commonwealth Fund Biennial Health Insurance Survey (2018).
EXHIBIT 15 Premiums for Employer Health Plans Climbed in 2017 Average growth from previous year Family plans Single-person plans Data: Medical Expenditure Panel Survey–Insurance Component (MEPS–IC), 2008–2017. Source: Sara R. Collins and David C. Radley, The Cost of Employer Insurance Is a Growing Burden for Middle-Income Families(Commonwealth Fund, Dec. 2018).
EXHIBIT 16 Worker Payments for Employer Coverage Are Growing Faster than Median Income Employee premium contribution as share of median income Average employee premium contribution as percent of median state income in 2017 4.8%–5.9% (16 states + D.C.) 6.0%–7.9% (23 states) 8.0%–10.2% (11 states) Notes: Estimates of median household income used in the denominator for this ratio come from the Current Population Survey (CPS), which revised its income questions in 2013. The denominator in our ratio estimates prior to 2014 is derived from the traditional CPS income questions, while ratio estimates from 2017 are estimated from the revised income questions. Household incomes have been adjusted for the likelihood that people in the same residence purchase health insurance together. Data: Employee premium contribution: Medical Expenditure Panel Survey–Insurance Component (MEPS–IC), 2008, 2011, 2017; Median household income: Current Population Survey, 2008–09, 2011–12, 2017–18. Source: Sara R. Collins and David C. Radley, The Cost of Employer Insurance Is a Growing Burden for Middle-Income Families (Commonwealth Fund, Dec. 2018).
EXHIBIT 17 Average Deductibles Are Also Outpacing Growth in Median Income Deductible as share of median income Average single-person deductibles for employer coverage, by state, 2017 $2,303 $2,305 U.S. average = $1,808 $863 Notes: Estimates of median household income used in the denominator for this ratio come from the Current Population Survey (CPS), which revised its income questions in 2013. The denominator in our ratio estimates prior to 2014 is derived from the traditional CPS income questions, while ratio estimates from 2017 are estimated from the revised income questions. Household incomes have been adjusted for the likelihood that people in the same residence purchase health insurance together. Data: Deductible: Medical Expenditure Panel Survey–Insurance Component (MEPS–IC), 2008, 2011, 2017; Median household income: Current Population Survey, 2008–09, 2011–12, 2017–18. Source: Sara R. Collins and David C. Radley, The Cost of Employer Insurance Is a Growing Burden for Middle-Income Families (Commonwealth Fund, Dec. 2018).
EXHIBIT 18 Premium and Deductible Costs Amounted to Nearly 12 Percent of Median Income in 2017 Combined employee premium contribution and deductible as share of median income Average employee premium contribution plus average deductible as percent of median state income in 2017 7.8%–9.9% (11 states + D.C.) 10.0%–11.9% (21 states) 12.0%–15.5% (18 states) Notes: Estimates of median household income used in the denominator for this ratio come from the Current Population Survey (CPS), which revised its income questions in 2013. The denominator in our ratio estimates prior to 2014 is derived from the traditional CPS income questions, while ratio estimates from 2017 are estimated from the revised income questions. Household incomes have been adjusted for the likelihood that people in the same residence purchase health insurance together. Data: Employee premium contribution and deductible: Medical Expenditure Panel Survey–Insurance Component (MEPS–IC), 2008, 2011, 2017; Median household income: Current Population Survey, 2008–09, 2011–12, 2017–18. Source: Sara R. Collins and David C. Radley, The Cost of Employer Insurance Is a Growing Burden for Middle-Income Families (Commonwealth Fund, Dec. 2018).
EXHIBIT 19 Even Bronze Plan Premiums Are High Relative to Income in Many States for Those Earning Just Over the Subsidy Threshold 2019 HealthCare.gov premiums as a percentage of income for 40-year-olds earning $49,000 8%-9% 10%-11% Bronze plan Gold plan 12%-15% 11%-14% 15%-17% Data: 2019 Marketplace QHP landscape data for 2019. Available at healthcare.gov. 18%-23%
EXHIBIT 20 U.S. Health Insurance System Is Currently Both Private and Public Source: Analysis of the 2018 U.S. Current Population Survey by Ougni Chakraborty and Sherry Glied of New York University for the Commonwealth Fund.
EXHIBIT 21 Options to Increase Coverage and Affordability of Individual Market Plans * Change in silver premiums for a 40-year-old nonsmoker. Source: Jodi Liu and Christine Eibner, Expanding Enrollment Without the Individual Mandate: Options to Bring More People into the Individual Market (Commonwealth Fund, Aug. 2018).
EXHIBIT 22 Prices, Not Utilization, Are Driving Spending Growth in Private Insurance Cumulative change in spending per person, utilization, and average price since 2013 Note: Utilization and average prices account for changes in the type or intensity of services used, with the exception of prescription drugs. Prescription drug spending is the amount paid on the pharmacy claim, which reflects discounts from the wholesale price, but not manufacturer rebates. Source: Health Care Cost Institute, 2017 Health Care Cost and Utilization Report (HCCI, Feb. 2019).
EXHIBIT 23 Health Care Spending as a Percent of GDP, 1980–2017Adjusted for Differences in Cost of Living Percent of GDP 2017* data: 2017* Notes: Current expenditures on health per capita, adjusted for current US$ purchasing power parities (PPPs). Based on System of Health Accounts methodology, with some differences between country methodologies (Data for Australia uses narrower definition for long-term care spending than other countries). *2017 data are provisional or estimated. Source: OECD Health Data 2018.
EXHIBIT 24 Health Care Spending per Capita by Source of Funding, 2017Adjusted for Differences in Cost of Living Dollars (US) Data from 2017 or most recent year: 2016 for FRA, SWIZ, UK and the US, and 2015 for AUS. Current expenditures on health, adjusted for US$ purchasing power parities (PPPs). Numbers may not sum to total health care spending per capita due to excluding capital formation of health care providers, and some uncategorized health care spending. * For the US, spending in the ‘Compulsory private insurance schemes’ (HF122) category has been reclassified into the “Voluntary health insurance schemes” (HF21) category, given that the individual mandate will end starting in 2019. Source: OECD Health Data 2018.