Global Health Spending Trends: An In-depth Analysis
20 likes | 138 Vues
Explore a comprehensive overview of international health expenditure trends from 1980 to 2007, including per capita spending and GDP percentages. Data sourced from esteemed surveys and reports. Discover how countries compare in healthcare financing.

Global Health Spending Trends: An In-depth Analysis
E N D
Presentation Transcript
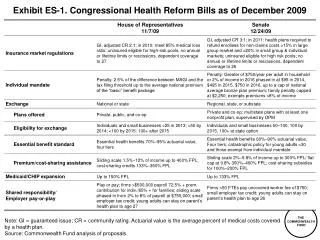
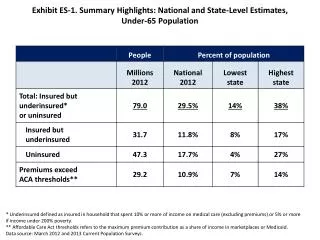
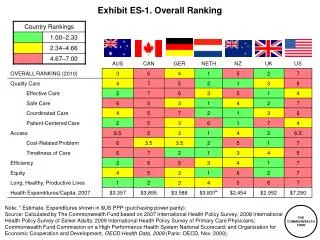
Exhibit ES-1. Overall Ranking Note: * Estimate. Expenditures shown in $US PPP (purchasing power parity). Source: Calculated by The Commonwealth Fund based on 2007 International Health Policy Survey; 2008 International Health Policy Survey of Sicker Adults; 2009 International Health Policy Survey of Primary Care Physicians; Commonwealth Fund Commission on a High Performance Health System National Scorecard; and Organization for Economic Cooperation and Development, OECD Health Data, 2009 (Paris: OECD, Nov. 2009).
Average spending on healthper capita ($US PPP) Total expenditures on healthas percent of GDP Exhibit 1. International Comparison of Spending on Health, 1980–2007 16% $7,290 8% $2,454 Note: $US PPP = purchasing power parity. Source: Organization for Economic Cooperation and Development, OECD Health Data, 2009 (Paris: OECD, Nov. 2009).