Exhibit ES-1. Congressional Health Reform Bills as of December 2009
Exhibit ES-1. Congressional Health Reform Bills as of December 2009 Note: GI = guaranteed issue; CR = community rating. Actuarial value is the average percent of medical costs covered by a health plan. Source: Commonwealth Fund analysis of proposals.
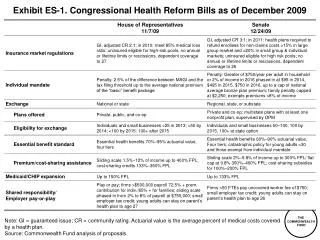

Exhibit ES-1. Congressional Health Reform Bills as of December 2009
E N D
Presentation Transcript
Exhibit ES-1. Congressional Health Reform Bills as of December 2009 Note: GI = guaranteed issue; CR = community rating. Actuarial value is the average percent of medical costs covered by a health plan. Source: Commonwealth Fund analysis of proposals.
Exhibit ES-2. Major Sources of Savings and Revenues Compared with Projected Spending, Net Cumulative Effect on Federal Deficit, 2010–2019 Dollars in billions Note: Totals do not reflect net impact on deficit because of rounding. Source: The Congressional Budget Office Cost Estimate of the Patient Protection and Affordable Care Act, Dec. 19, 2009, http://www.cbo.gov/doc.cfm?index=10868. The Congressional Budget Office Analysis of H.R. 3962, The Affordable Health Care for America Act, Nov. 20, 2009, http://www.cbo.gov/doc.cfm?index=10741.
Exhibit ES-3. Trend in the Number of Uninsured Nonelderly, 2012–2019Under Current Law and House and Senate Bills Millions Note: The uninsured includes unauthorized immigrants. With unauthorized immigrants excluded from the calculation, nearly 94% and 96% of legal nonelderly residents are projected to have insurance under the Senate and House proposals, respectively. Data: Estimates by The Congressional Budget Office.
Exhibit ES-4. Premium Caps as a Share of Income Under House and Senate Bills Percent Medicaid Medicaid Medicaid Income for a Family of Four % FPL (Annual Income) Note: FPL refers to Federal Poverty Level (2009). Under the House bill, people are eligible for Medicaid up to 150% FPL; under the Senate bill, people are eligible for Medicaid up to 133% FPL. Source: Commonwealth Fund analysis of proposals.
Exhibit ES-5. Annual Premium Amount Paid Out-of-Pocket by Individuals and Subsidies Under House and Senate Bills* Annual premium amount paid out-of-pocket by individual plus premium subsidy 200% FPL 300% FPL 150% FPL 400% FPL 500% FPL Subsidy Subsidy Subsidy Subsidy Subsidy Full Premium = $7,911 3,666 Full Premium = $6,339 4,727 1,140 6,547 7,172 3,090 7,911 5,147 Full Premium = $3,169 6,339 Full Premium = $2,637 5,198 4,245 1,978 3,184 1,273 3,249 3,169 3,169 3,169 1,898 2,637 2,637 2,637 Medicaid Medicaid 1,365 1,365 1,191 1,191 739 739 Age 20 Age 60 Age 20 Age 60 House Senate * For an individual in a medium-cost area in 2009. FPL refers to Federal Poverty Level. Premium estimates are based on: House Basic Plan, actuarial value = 0.70; Senate Silver Plan, actuarial value = 0.70. Actuarial value is the average percent of medical costs covered by a health plan. Source: Premium estimates are from Kaiser Family Foundation Health Reform Subsidy Calculator – Premium Assistance for Coverage in Exchanges/Gateways, http://healthreform.kff.org/Subsidycalculator.aspx.
Exhibit ES-6. Small Business Tax Credits Under House and Senate Bills for Family Premiums Credit per employee $9,435—projected family premium under House & Senate 65% employer contribution 50% employer contribution $6,133* $4,718* $4,718* $4,718* * To be eligible for tax credits, firms must contribute 65% of premiums per family under the House plan, and 50% under the Senate plan. Firms receive 50% of their contribution in tax credits under House, and 35% and later 50% of contribution under Senate. Note: Projected premium for a family of four in a medium-cost area in 2009 (age 40). Premium estimates are based on: House Basic Plan, actuarial value = 0.70; Senate Silver Plan, actuarial value = 0.70. Actuarial value is the average percent of medical costs covered by a health plan. Under the House bill, small firms are defined as those with fewer than 25 employees with average wages below $40,000. The full credit is available to firms with fewer than 10 employees and average wages less than $20,000; credits phase out up to 25 employees average wages of $40,000.Under the Senate bill, small firms are defined as those with fewer than 25 employees with average wages below $50,000. The full credit is available to firms with 10 or fewer employees and average wages less than $25,000; credits phase out up to 25 employees average wages of $50,000. Source: Commonwealth Fund analysis of proposals. Premium estimates are from Kaiser Family Foundation Health Reform Subsidy Calculator, http://healthreform.kff.org/Subsidycalculator.aspx.
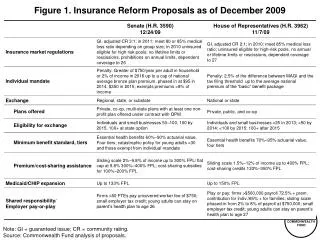
Exhibit 1. Congressional Health Reform Bills as of December 2009 Note: GI = guaranteed issue; CR = community rating. Actuarial value is the average percent of medical costs covered by a health plan. Source: Commonwealth Fund analysis of proposals.
Exhibit 2. Federal Poverty Level, by Annual Income and Family Size, 2009 Note: FPL refers to Federal Poverty Level. Source: U.S. Census Bureau, 2009.
Exhibit 3. Major Sources of Savings and Revenues Compared with Projected Spending, Net Cumulative Effect on Federal Deficit, 2010–2019 Dollars in billions Note: Totals do not reflect net impact on deficit because of rounding. Source: The Congressional Budget Office Cost Estimate of the Patient Protection and Affordable Care Act, Dec. 19, 2009, http://www.cbo.gov/doc.cfm?index=10868. The Congressional Budget Office Analysis of H.R. 3962, The Affordable Health Care for America Act, Nov. 20, 2009, http://www.cbo.gov/doc.cfm?index=10741.
Exhibit 4. Trend in the Number of Uninsured Nonelderly, 2012–2019Under Current Law and House and Senate Bills Millions Note: The uninsured includes unauthorized immigrants. With unauthorized immigrants excluded from the calculation, nearly 94% and 96% of legal nonelderly residents are projected to have insurance under the Senate and House proposals, respectively. Data: Estimates by The Congressional Budget Office.
Exhibit 5. Source of Insurance Coverage Under Current Law and House and Senate Bills, 2019 54 M (19%) Uninsured 16 M (6%) Other 162 M (57%) ESI 4 M (1%) Exchange (Public Plan)* 15 M (5%) Nongroup 18 M (6%) Uninsured 23 M (8%) Uninsured 24 M (9%) Uninsured 35 M (12%) Medicaid 17 M (6%) Exchange (Private Plans) 26 M (9%) Exchanges (Private Plans) 16 M (6%) Other 16 M (6%) Other Current Law 9 M (3%) Nongroup 168 M (60%) ESI 158 M (56%) ESI 10 M (4%) Nongroup 50 M (18%) Medicaid 50 M (18%) Medicaid House Senate Among 282 million people under age 65 * CBO estimates 20% of people enrolled in exchange will choose public plan under House bill. Employees whose employers provide coverage through the exchange are shown as covered by their employers (9 million in the House bill and 5 million in the Senate bill), thus about 30 million people would be enrolled through plans in the exchange under both bills. Note: ESI is Employer-Sponsored Insurance. Source: Revised Estimate of the Affordable Health Care for America Act, Congressional Budget Office Letter to the Honorable John Dingell, November 20, 2009, http://www.cbo.gov/doc.cfm?index=10741. The Congressional Budget Office Analysis of the Patient Protection and Affordable Care Act, Incorporating the Manager’s Amendment, Dec. 19, 2009, http://cbo.gov/doc.cfm?index=10868.
Exhibit 7. Essential Benefit Package Requirements Under House and Senate Bills Note: Actuarial values is the average percent of medical costs covered by a health plan. Source: Commonwealth Fund analysis of health reform proposals.
Exhibit 8. Premium SubsidiesUnder House and Senate Bills Note: FPL refers to Federal Poverty Level. Source: Commonwealth Fund analysis of health reform proposals.
Exhibit 9. Cost-Sharing Credits and LimitsUnder House and Senate Bills Note: FPL refers to Federal Poverty Level. OOP is defined as “out-of-pocket” costs. Actuarial value is the average percent of medical costs covered by a health plan. Source: Commonwealth Fund analysis of health reform proposals.
Exhibit 10. Premium Caps as a Share of Income Under House and Senate Bills Percent Medicaid Medicaid Medicaid Income for a Family of Four % FPL (Annual Income) Note: FPL refers to Federal Poverty Level (2009). Under the House bill, people are eligible for Medicaid up to 150% FPL; under the Senate bill, people are eligible for Medicaid up to 133% FPL. Source: Commonwealth Fund analysis of proposals.
Exhibit 11. Family Premiums Under House and Senate Bills* After Premium Subsidies Income for a Family of Four % FPL (Annual Income) * For a family of four in a medium-cost area in 2009 (age 40). Premium estimates are based on: Senate Silver Plan, actuarial value = 0.70; House Basic Plan, actuarial value = 0.70. Actuarial value is the average percent of medical costs covered by a health plan. ** Senate bill exempts individuals with premium contributions in excess of 8 percent of income from requirement to buy insurance. Note: FPL refers to Federal Poverty Level. Under the Senate bill, people are eligible for Medicaid up to 133% FPL; under the House bill, people are eligible for Medicaid up to 150% FPL. CBO estimated an average family premium of $14,400 in 2016 for the Senate Finance bill, approximately $10,000 in 2009. Source: Commonwealth Fund analysis of proposals. Premium estimates are from Kaiser Family Foundation Health Reform Subsidy Calculator – Premium Assistance for Coverage in Exchanges/Gateways, http://healthreform.kff.org/Subsidycalculator.aspx.
Exhibit 12. Annual Premium Amount Paid Out-of-Pocket by Families and Subsidies Under House and Senate Bills* Annual premium amount paid out-of-pocket by family plus premium subsidy House Premium Paid by Family Premium Subsidy Senate Premium Paid by Family Premium Subsidy $9,435 $9,435 $9,435 $9,435 $9,435 $9,435 $9,435 791 2,952 2,820 6,656 7,009 7,930 8,644 9,435 6,483 6,615 Medicaid 2,778 2,426 1,505 200% FPL 300% FPL 400% FPL 150% FPL * For a family of four in a medium-cost area in 2009 (age 40). Premium estimates are based on: House Basic Plan, actuarial value = 0.70; Senate Silver Plan, actuarial value = 0.70. FPL refers to Federal Poverty Level. Actuarial value is the average percent of medical costs covered by a health plan. Source: Premium estimates are from Kaiser Family Foundation Health Reform Subsidy Calculator – Premium Assistance for Coverage in Exchanges/Gateways, http://healthreform.kff.org/Subsidycalculator.aspx.
Exhibit 13. Annual Premium Amount Paid Out-of-Pocket by Individuals and Subsidies Under House and Senate Bills* Annual premium amount paid out-of-pocket by individual plus premium subsidy 200% FPL 300% FPL 150% FPL 400% FPL 500% FPL Subsidy Subsidy Subsidy Subsidy Subsidy Full Premium = $7,911 3,666 Full Premium = $6,339 4,727 1,140 6,547 7,172 3,090 7,911 5,147 Full Premium = $3,169 6,339 Full Premium = $2,637 5,198 4,245 1,978 3,184 1,273 3,249 3,169 3,169 3,169 1,898 2,637 2,637 2,637 Medicaid Medicaid 1,365 1,365 1,191 1,191 739 739 Age 20 Age 60 Age 20 Age 60 House Senate * For an individual in a medium-cost area in 2009. FPL refers to Federal Poverty Level. Premium estimates are based on: House Basic Plan, actuarial value = 0.70; Senate Silver Plan, actuarial value = 0.70. Actuarial value is the average percent of medical costs covered by a health plan. Source: Premium estimates are from Kaiser Family Foundation Health Reform Subsidy Calculator – Premium Assistance for Coverage in Exchanges/Gateways, http://healthreform.kff.org/Subsidycalculator.aspx.
Exhibit 14. Percent of Income Spent on Premiums 2009–2019 If the Percent of Total Premiums Paid by Families Remains Constant, House and Senate Bills* Percent of income spent on premiums 200% FPL 400% FPL 150% FPL 300% FPL * For a family of four in a medium-cost area in 2009 (age 40). FPL refers to Federal Poverty Level. Premium estimates are based on House Basic Plan, actuarial value = 0.70, Senate Silver Plan, actuarial value = 0.70; Actuarial value is the average percent of medical costs covered by a health plan. 2009 premium estimates are from Kaiser Family Foundation Health Reform Subsidy Calculator – Premium Assistance for Coverage in Exchanges/Gateways, http://healthreform.kff.org/Subsidycalculator.aspx. Source: Commonwealth Fund analysis of the proposals.
Exhibit 15. Percent of Total Annual Medical Costs, Excluding Premiums, Paid by Enrollee Net of Subsidies Under House and Senate Bills* Percent Medicaid Medicaid Medicaid * For a family of four in a medium-cost area in 2009 (age 40). FPL refers to Federal Poverty Level. Cost-sharing estimates are based on:House Basic Plan, actuarial value = 0.70; Senate Silver Plan, actuarial value = 0.70. Actuarial value is the average percent of medical costs covered by a health plan. Under the Senate bill, people are eligible for Medicaid up to 133% FPL; under the House bill, people are eligible for Medicaid up to 150% FPL. Note: CBO estimated an average family premium of $14,400 in 2016 for the Senate Finance bill, approximately $10,000 in 2009. Source: Commonwealth Fund analysis of proposals. Premium estimates are from Kaiser Family Foundation Health Reform Subsidy Calculator – Premium Assistance for Coverage in Exchanges/Gateways, http://healthreform.kff.org/Subsidycalculator.aspx.
Exhibit 16. Distribution of Health Expenditures for the U.S. Population, by Magnitude of Expenditure, 2002 1% 5% 10% 20% 22% 49% 50% 64% 80% 97% 3% Source: L. J. Conwell and J. W. Cohen, Characteristics of People with High Medical Expenses in the U.S. Civilian Noninstitutionalized Population, 2002, Statistical Brief #73 (Washington, D.C.: Agency for Healthcare Research and Quality, March 2005).
Exhibit 17. Estimated Out-of-Pocket Exposure Under Senate Bill, Single Policy, by U.S. Spending Distribution and Income Note: Since the Senate bill caps out-of-pocket spending for people at 200–400% of poverty at $2,975 and $3,967, this analysis assumes a Silver plan of .70 actuarial value with the out-of-pocket maximums, which increase the actuarial value of the plan. FPL refers to Federal Poverty Level. Actuarial value is the average percent of medical costs covered by a health plan. The out-of-pocket maximums are provisions in the bill, deductibles and coinsurance rates are assumed. Source: Commonwealth Fund analysis of health reform proposals.
Exhibit 18. Estimated Out-of-Pocket Exposure Under House Bill, Single Policy, by U.S. Spending Distribution and Income Note: FPL refers to Federal Poverty Level. The out-of-pocket maximums are provisions in the bill, deductibles and coinsurance rates are assumed. Actuarial value is the average percent of medical costs covered by a health plan. Source: Commonwealth Fund analysis of health reform proposals.
Exhibit 19. Penalties for Noncompliance with the Individual Mandate Under House and Senate Bills Senate (2016) House Penalty per Person Senate (2015) = $495 Senate (2014) = $95 Income Note: The penalty under the Senate bill is implemented at $95 in 2014 and increases to $495 in 2015 and the greater of $750 or up to 2% of income, capped at the average national bronze plan premium, in 2016. The House penalty is calculated as 2.5% of the difference between average modified adjusted gross income (MAGI) and the tax filing threshold, capped at the average national premium of the basic benefit package. Calculations begin at $20,000 because that is the point where MAGI exceeds the tax filing threshold. People are exempt if they have household incomes under 100% FPL or if premiums are greater than 8% (Senate). Projected premiums are under House and Senate proposals. Source: Commonwealth Fund analysis of the proposals; Urban-Brookings Tax Policy Center, “Average Modified Gross Income and Average Modified Adjusted Gross Income Across Cash Income Levels, 2009”, Oct 15, 2009 available at http://www.taxpolicycenter.org/numbers/displayatab.cfm?Docid=2486&DocTypeID=1.
Exhibit 20. Employer Coverage Continues to Be Major Source of Coverage for Employees of Larger Firms But Has Declined Among Small Firms Percent of firms offering health benefits Source: The Kaiser Family Foundation/Health Research and Educational Trust, Employer Health Benefits, 2000 and 2009 Annual Surveys.
Exhibit 21. Penalties for Noncompliance with the Employer Mandate Under House and Senate Bills $3,282 (8% tax of 2008 median earnings) Penalty per Employee $750 penalty $821 (2% tax of 2008 median earnings) Note: House bill penalty is based on aggregate payroll. It is illustrated here using 2008 median earnings to estimate firm size. A firm with an aggregate payroll of $500,000 will have an average of 12 workers and a firm with an aggregate payroll of $750,000 will have an average of 18 workers. The payroll tax is implemented on a sliding scale from 2%–8% for payrolls between $500,000 and $750,000. The Senate bill penalty requires any employer with more than 50 full-time employees that does not offer coverage and has at least one full-time employee receiving the premium assistance tax credit to make a payment of $750 per full-time employee. An employer with more than 50 employees that offers coverage that is deemed unaffordable or does not meet the minimum benefit standard and has at least one full-time employee receiving the premium assistance tax credit must pay the lesser of $3,000 for each of those employees receiving the credit or $750 for each of their full-time employees total. Firms are exempt if they have: a payroll less than $500,000 (House), or fewer than 50 workers (Senate). Data: Median earnings among workers working 50–52 weeks annually was $41,030 (Table P–43, Historical Income Data, Current Population Survey). Source: Commonwealth Fund analysis of the proposals.
Exhibit 22. Small Business Tax Credits Under House and Senate Bills for Family Premiums Credit per employee $9,435—projected family premium under House & Senate 65% employer contribution 50% employer contribution $6,133* $4,718* $4,718* $4,718* * To be eligible for tax credits, firms must contribute 65% of premiums per family under the House plan, and 50% under the Senate plan. Firms receive 50% of their contribution in tax credits under House, and 35% and later 50% of contribution under Senate. Note: Projected premium for a family of four in a medium-cost area in 2009 (age 40). Premium estimates are based on: House Basic Plan, actuarial value = 0.70; Senate Silver Plan, actuarial value = 0.70. Actuarial value is the average percent of medical costs covered by a health plan. Under the House bill, small firms are defined as those with fewer than 25 employees with average wages below $40,000. The full credit is available to firms with fewer than 10 employees and average wages less than $20,000; credits phase out up to 25 employees average wages of $40,000.Under the Senate bill, small firms are defined as those with fewer than 25 employees with average wages below $50,000. The full credit is available to firms with 10 or fewer employees and average wages less than $25,000; credits phase out up to 25 employees average wages of $50,000. Source: Commonwealth Fund analysis of proposals. Premium estimates are from Kaiser Family Foundation Health Reform Subsidy Calculator, http://healthreform.kff.org/Subsidycalculator.aspx.
NH ME WA VT ND MT MN OR MA NY WI SD ID RI MI WY CT PA NJ IA OH NE DE NV IN IL MD WV UT VA DC CO CA MO KS KY NC TN OK SC AR AZ NM GA MS AL LA TX FL Exhibit 23. Concentrated Insurance Markets: Market Share of Two Largest Health Plans, by State, 2006 80%–100% AK 70%–79% HI 50%–69% Less than 50% Note: Market shares include combined HMO+PPO products. For MS and PA share = top 3 insurers 2002–2003. No data are available for Washington, D.C. Source: American Medical Association, Competition in Health Insurance: A Comprehensive Study of U.S. Markets, 2008 Update; MS and PA from J. Robinson, “Consolidation and the Transformation of Competition in Health Insurance,” Health Affairs, Nov/Dec 2004; ND from D. McCarthy et al., “The North Dakota Experience: Achieving High-Performance Health Care Through Rural Innovation and Cooperation,” The Commonwealth Fund, May 2008.