Download
1 / 27
270 likes | 418 Vues
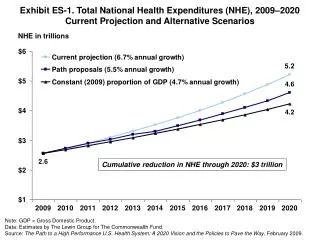
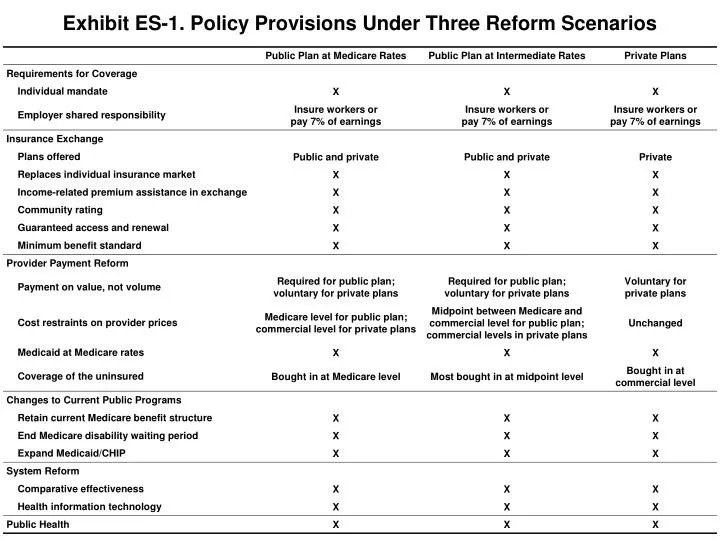
Exhibit ES-1. Policy Provisions Under Three Reform Scenarios. 6.5% annual growth. 5.2% annual growth. 5.6% annual growth. THE COMMONWEALTH FUND. Exhibit ES-2. Total National Health Expenditures (NHE), 2009–2020: Current Projection and Alternative Scenarios. NHE in trillions. $5.0. $4.7.

E N D
Exhibit ES-1. Policy Provisions Under Three Reform Scenarios
6.5% annual growth 5.2% annual growth 5.6% annual growth THE COMMONWEALTH FUND Exhibit ES-2. Total National Health Expenditures (NHE), 2009–2020:Current Projection and Alternative Scenarios NHE in trillions $5.0 $4.7 $4.6 $4.4 5.8% annual growth $2.5 Data: Estimates by The Lewin Group for The Commonwealth Fund.
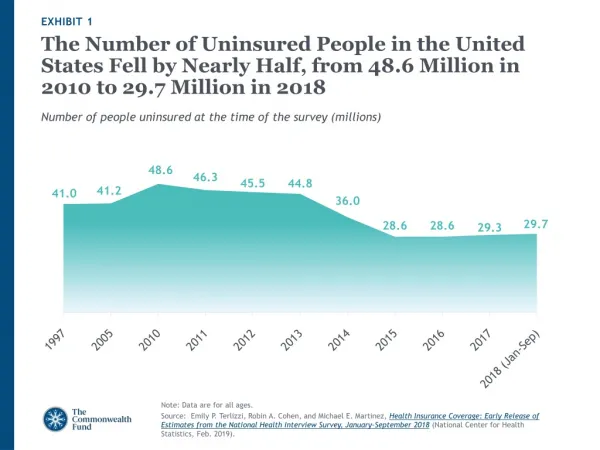
THE COMMONWEALTH FUND Exhibit ES-3. Trend in the Number of Uninsured, 2009–2020 Under Current Law and Three Path Scenarios Millions Note: Assumes insurance exchange opens in 2010 and take-up by uninsured occurs over two years. Remaining uninsured are mainly non-tax-filers. Data: Estimates by The Lewin Group for The Commonwealth Fund.
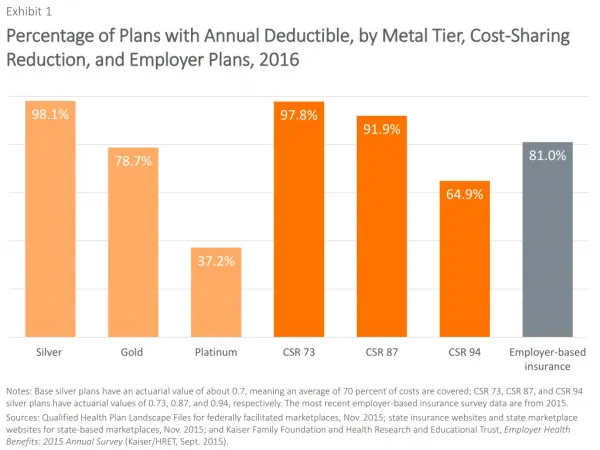
THE COMMONWEALTH FUND Exhibit ES-4. Estimated Annual PremiumsUnder Different Scenarios, 2010 Average annual premium per household for same benefits at community rate* 3% 14% 16% 25% * Premiums for same benefits and population. Benefits used to model: full scope of acute care medical benefits; $250 individual/$500 family deductible; 10% coinsurance physicians services; 25% coinsurance, no deductible prescription drugs ; full coverage preventive care. $5,000 individual/$7,000 family out-of-pocket cost limit. Data: Estimates by The Lewin Group for The Commonwealth Fund.
THE COMMONWEALTH FUND Exhibit ES-5. Net Cumulative Impact on National Health Expenditures, 2010–2020 Compared with Baseline,Three Insurance Exchange Scenarios, by Major Payer Groups Dollars in billions $2,993 $1,969 $1,186 Note: A negative number indicates spending increases compared with projected expenditures;a positive indicates spending decreases (i.e., savings). Data: Estimates by The Lewin Group for The Commonwealth Fund.
THE COMMONWEALTH FUND ExhibitES-6.ChangeinNetFederalSpendingUnderThreePathScenarios Billions Note: A negative number indicates spending decreases compared with projected expenditures (i.e., savings); a positive indicates spending increases. Data: Estimates by The Lewin Group for The Commonwealth Fund.
THE COMMONWEALTH FUND Exhibit 2. Three Insurance Exchange Scenarios:Cumulative 11-Year Savings in National Health Expenditures, 2010–2020 Cumulative national health expenditure savings compared with baseline (trillions) Data: Estimates by The Lewin Group for The Commonwealth Fund.
6.5% annual growth 5.2% annual growth 5.6% annual growth THE COMMONWEALTH FUND Exhibit 3. Total National Health Expenditures (NHE), 2009–2020:Current Projection and Alternative Scenarios NHE in trillions $5.0 $4.7 $4.6 $4.4 5.8% annual growth $2.5 Data: Estimates by The Lewin Group for The Commonwealth Fund.
Exhibit 4. Major Sources of Savings Compared with Projected Spending,Net Cumulative Reduction of National Health Expenditures, 2010–2020 Dollars in billions Data: Estimates by The Lewin Group for The Commonwealth Fund, April–May, 2009.
THE COMMONWEALTH FUND Exhibit 5. Trend in the Number of Uninsured, 2009–2020Under Current Law and Three Path Scenarios Millions Note: Assumes insurance exchange opens in 2010 and take-up by uninsured occurs over two years. Remaining uninsured are mainly non-tax-filers. Data: Estimates by The Lewin Group for The Commonwealth Fund.
THE COMMONWEALTH FUND Exhibit 6. Benefit Design for Public Health Insurance PlanOffered in Insurance Exchange * Basic benefits before Medigap. ** Part D coverage varies, often deductible. Most have “doughnut” hole and use tiered, flat-dollar copayments. Note: Benefit design also would apply to Medicare Extra supplement option available to Medicare beneficiaries. Source: Commonwealth Fund Commission on a High Performance Health System, The Path to a High PerformanceU.S. Health System: A 2020 Vision and the Policies to Pave the Way (New York: The Commonwealth Fund, Feb. 2009.
THE COMMONWEALTH FUND Exhibit 7. Premium Affordability: Insurance-Related Premium Subsidies Note: Family income ranges based on family size of three. Source: United States Department of Health and Human Services, “Annual Update of the HHS Poverty Guidelines,” Federal Register: Jan. 23, 2009 (Vol. 74, No. 14), 4199-4201; United States Internal Revenue Service, 2009 Tax Rate Schedule X and Y-1.
THE COMMONWEALTH FUND Exhibit 8. Estimated Annual PremiumsUnder Different Scenarios, 2010 Average annual premium per household for same benefits at community rate* 3% 14% 16% 25% * Premiums for same benefits and population. Benefits used to model: full scope of acute care medical benefits; $250 individual/$500 family deductible; 10% coinsurance physicians services; 25% coinsurance, no deductible prescription drugs ; full coverage preventive care. $5,000 individual/$7,000 family out-of-pocket cost limit. Data: Estimates by The Lewin Group for The Commonwealth Fund.
THE COMMONWEALTH FUND Exhibit 9.Medicare Advantage Plans Bids as a Percent ofAverage Medicare Fee-for-Service Costs, by Plan Type, 2009 Percent of Medicare fee-for-service spending Note: HMOs = health maintenance organizations; PPOs = preferred provider organizations;PFFS = private fee-for-service plans. Source: Medicare Payment Advisory Commission, Report to the Congress: Medicare Payment Policy (Washington, D.C.: MedPAC, March 2009).
THE COMMONWEALTH FUND Exhibit 10. Employers Remain Primary Sponsor of CoverageUnder Three Reform ScenariosDistribution of 307 Million People by Primary Source of Coverage Current Law (2010) Public Plan at Medicare Rates (2014) Public Plan at Intermediate Rates (2014) Uninsured 49 m 16% Uninsured 4 m 1% Uninsured 4 m 1% Medicaid 41 m 14% Employer Direct 164 m 53% Employer Direct 55 m 18% Medicaid 49 m 16% Medicaid 49 m 16% Medicare 39 m 13% Employer Direct 93 m 30% Individual Direct 14 m 5% Medicare 41 m 13% Medicare 41 m 13% Uninsured 4 m 1% Employer Exchange 141 m 46% Employer Exchange 102 m 33% Medicaid 50 m 16% Employer Direct 122 m 41% Individual Exchange 18 m 6% Individual Exchange 18 m 6% Medicare 41 m 13% Individual Exchange 19 m 6% Employer Exchange 72 m 23% Private Plans (2014) Data: Estimates by The Lewin Group for The Commonwealth Fund.
THE COMMONWEALTH FUND Exhibit 11. Source of New Coverage for the UninsuredUnder Three Reform Scenarios, 2014 Public Plan at Medicare Rates Public Plan at Intermediate Rates Private Plans Uninsured 4 m 8% Uninsured 4 m 8% Uninsured 4 m 8% Employer Direct 5 m 11% Employer Direct 10 m 21% Employer Direct 13 m 28% Medicaid 13 m 27% Medicaid 13 m 27% Medicaid 13 m 27% Employer Exchange 17 m 34% Employer Exchange 12 m 25% Employer Exchange 8 m 17% Individual Exchange 10 m 19% Individual Exchange 9 m 19% Individual Exchange 9 m 19% Medicare <1 m <1% Medicare <1 m <1% Medicare <1 m <1% Data: Estimates by The Lewin Group for The Commonwealth Fund.
THE COMMONWEALTH FUND Exhibit 12. Source of Improved or More Affordable CoverageUnder Three Reform Scenarios, 2014 Public Plan at Medicare Rates Public Plan at Intermediate Rates Private Plans Medicare 2 m 1% Employer Direct 9 m 5% Medicare 2 m 1% Medicare 2 m 1% Individual Exchange 18 m 10% Medicaid 16 m 8% Employer Direct 16 m 10% Medicaid 16 m 10% Medicaid 16 m 12% Individual Exchange 18 m 12% Employer Direct 21 m 16% Individual Exchange 19 m 14% Employer Exchange 72 m 57% Employer Exchange 102 m 66% Employer Exchange 141 m 76% Data: Estimates by The Lewin Group for The Commonwealth Fund.
THE COMMONWEALTH FUND Exhibit 13. Net Cumulative Impact on National Health Expenditures,2010–2020 Compared with Baseline,Three Insurance Exchange Scenarios, by Major Payer Groups Dollars in billions $2,993 $1,969 $1,186 Note: A negative number indicates spending increases compared with projected expenditures;a positive indicates spending decreases (i.e., savings). Data: Estimates by The Lewin Group for The Commonwealth Fund.
THE COMMONWEALTH FUND Exhibit 14. Change in Net Federal Spending Under Three Path Scenarios Billions Note: A negative number indicates spending decreases compared with projected expenditures (i.e., savings); a positive indicates spending increases. Data: Estimates by The Lewin Group for The Commonwealth Fund.
Exhibit 15. Average Annual Savings per FamilyUnder Three Reform Scenarios, 2020 THE COMMONWEALTH FUND Data: Estimates by the Lewin Group for The Commonwealth Fund.
THE COMMONWEALTH FUND Exhibit 16. Cost of Administering Health Insurance as a Percentage of Claims Under Current Law and the Proposed Exchange, by Group Size Percent Data: Estimates by The Lewin Group for The Commonwealth Fund. Source: Commonwealth Fund Commission on a High Performance Health System, The Path to a High Performance U.S. Health System: A 2020 Vision and the Policies to Pave the Way, (New York: The Commonwealth Fund, Feb. 2009).
THE COMMONWEALTH FUND Exhibit 17. Cost of Administering Health Insurance as a Percentage of Claims Under Current Law and the Proposed Exchange Percent 12.7% 9.4% Data: Estimates by The Lewin Group for The Commonwealth Fund. Source: Commonwealth Fund Commission on a High Performance Health System, The Path to a High Performance U.S. Health System: A 2020 Vision and the Policies to Pave the Way, (New York: The Commonwealth Fund, Feb. 2009).
THE COMMONWEALTH FUND Exhibit 18. Total National Health Expenditure Growth for Hospitals, Current Projections and with Policy Changes, 2009–2020 NHE in billions 99% increase 82% increase 77% increase 68% increase 43% increase 39% increase 35% increase 29% increase 2009 2015 2020 Note: GDP = Gross Domestic Product. Data: Estimates by The Lewin Group for The Commonwealth Fund.
THE COMMONWEALTH FUND Exhibit 19. Total National Health Expenditure (NHE) Growth for Physicians, Current Projections and with Policy Changes, 2009–2020 NHE in billions 82%increase 64%increase 59%increase 51%increase 34%increase 30%increase 27%increase 21%increase 2009 2015 2020 Note: GDP = Gross Domestic Product. Data: Estimates by The Lewin Group for The Commonwealth Fund.
THE COMMONWEALTH FUND Exhibit 20. Achieving Benchmarks:Potential People Impact if the United States ImprovedNational Performance to the Level of the Benchmark * Targets are benchmarks of top 10% performance within the U.S. or top countries(mortality amenable and electronic medical records). All preventive care is a target. Source: Commonwealth Fund Commission on a High Performance Health System, Why Not the Best? Results from the National Scorecard on U.S. Health System Performance, 2008 (New York: The Commonwealth Fund, July 2008), with benchmarks from top performance.
Exhibit 21. Net Impact of Insurance Exchange Options onFederal Budget and National Health Expenditures, 2010–2020 THE COMMONWEALTH FUND Note: 0 = no significant improvement; + slight improvement; ++ = moderate improvement; +++ = large improvement. Data: Estimates by the Lewin Group for The Commonwealth Fund.