Download
1 / 11
120 likes | 491 Vues
Three Common Misinterpretations of Significance Tests and p-values. 1. The p-value indicates the probability that the results are due to sampling error or “chance.” 2. A statistically significant result is a “reliable” result.

E N D
Three Common Misinterpretations of Significance Tests and p-values 1. The p-value indicates the probability that the results are due to sampling error or “chance.” 2. A statistically significant result is a “reliable” result. 3. A statistically significant result is a powerful, important result.
Misinterpretation # 1 • The p-value is a conditional probability. The probability of observing a specific range of sample statistics GIVEN (i.e., conditional upon) that the null hypothesis is true. P(D|Ho) • This is not equivalent to the probability of the null hypothesis being true, given the data. • P(Ho |D) P(D| Ho)
Misinterpretation # 1 • This later question (i.e., “How likely is it that the results are due to sampling error or chance?”) that tends to motivate the use of significance tests on the part of researchers. However, these tests do not answer this question directly. • In order to answer this question, one needs to consider additional pieces of information: (a) the likelihood that the null hypothesis is true before doing the study, (b) the probability of observing the data given other hypotheses (e.g., the alternative hypothesis), and (c) the probability that other hypotheses are true before doing the study.
Bayes’ Theorem • Bayes’ theorem provides a way to combine these different pieces of information: Note: You don’t need to memorize this formula, but please be able to use it and understand it.
P(H0) P(H1) P(D|H0) P(D|H1) P(H0|D) .50 .50 .05 .95 .05 .50 .50 .05 .01 .83 .90 .10 .05 .05 .90 .10 .90 .15 .50 .03 Here, P(H0|D) does = P(D|H0) Here, P(H0|D) > P(D|H0) Here, P(H0|D) > P(D|H0) Here, P(H0|D) < P(D|H0)
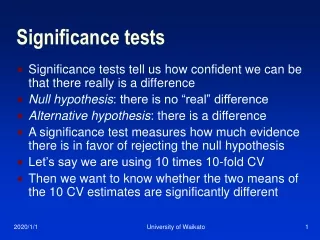
Misinterpretation # 2 • Is a significant result a “reliable,” easily replicated result? • Not necessarily. The p-value is a poor indicator of the replicability of a finding. • Replicability (assuming a real effect exists, that is, that he null hypothesis is false), is primarily a function of statistical power.
Misinterpretation # 2 • If a study had a statistical power equivalent to 80%, what is the probability of obtaining a “significant” result twice? • The probability of two independent events both occurring is the simple product of the probability of each of them occurring. • .80 .80 = .64 • If power = 50%? .50 .50 = .25 • Bottom line: The likelihood of replicating a result is determined by statistical power, not the p-value derived from a significance test. When power of the test is low, the likelihood of a long-run series of replications is even lower.
Misinterpretation # 3 • Is a significant result a powerful, important result? • Not necessarily. The importance of the result, of course, depends on the issue at hand, the theoretical context of the finding, etc.
Misinterpretation # 3 • We can measure the practical or theoretical significance of an effect using an index of effect size. • An effect size is a quantitative index of the strength of the relationship between two variables. • Some common measures of effect size that we’ve discussed in this class are correlations, regression weights, and R-squared. • (These same indices can be used when one or more of the variables of interest is categorical.)
Some common effect sizes in the “real world” Effect of aspirin on heart attacks r .01 Effect of psychotherapy on psychological well-being r .30 Correlation between personality as a child and personality as an adult r .25 Correlation between SAT and college GPA r .30
Misinterpretation # 3 • Importantly, the same effect size can have different p-values, depending on the sample size of the study. • For example, a correlation of .30 would not statistically significant with a sample size of 30, but would be statistically significant with a sample size of 130. • Bottom line: The p-value is a poor way to evaluate the practical “significance” of a research result.