Download

1 / 31
310 likes | 444 Vues
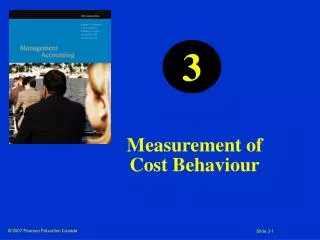
This assignment focuses on analyzing cost behavior with an emphasis on the High-Low method and regression analysis. You'll learn to distinguish between fixed, variable, and mixed costs, and how to apply these concepts to predict costs effectively. We will explore examples that demonstrate the application of the High-Low method, as well as the use of regression analysis for more accurate predictions. Understanding contribution margin and developing a contribution income statement will be key parts of this learning process.

E N D
Ch. 6 Assignment due Feb 4(Mon), 11.59pm • Sections 1 and 2 • Feb 1, 2013 • Professor: Khim Kelly • Office: HH386B • Office Hours: Mon/Wed 11:30am – 12:30pm and Appointment • Email: kokelly@uwaterloo.ca • TA: Kun Huo • Email: khuo@uwaterloo.ca Cost Behaviour: Part 2 of 2
1 Feb 2013 Overview • Last lecture … • Fixed costs, variable costs, step variable costs, mixed costs • How to use costs behaviour to predict costs • Analyze mixed costs (High-Low Method) • Major topics for today… • Analyse mixed costs (Regression) • Another example of High-Low method • The contribution margin approach
Regression • High-Low method uses only two data points • Improve accuracy of results by considering more data points • Regression analysis • Uses all the available data points • “Fits” a line to the data points while attempting to minimize errors. • Develops a similar looking equation to High-Low method • Both assume linearity • Need to be aware of potential differences in cost behaviour outside of the relevant range • When predicting costs, you might want to limit analysis to a range around expected activity The next slides plot data (from last lecture Clicker Question #3) with activity on the X axis and the mixed cost on the Y axis.
Last Lecture: Clicker Question #4: Answer $34,500 - $18,750 = 5,000 - 1,800 $15,750 = 3,200 = $4.92 per Patient-Day Then: = $34,500 a + ($4.92 * 5,000) = a $9,891 Answer: D. Y = $9,891 +$4.92X
Scattergram Plot Mixed Cost Patient days
High-Low Method Mixed Cost HL method: y= $4.92x + $9,891 Patient days
Least Squares Regression Method Mixed Cost HL method: y= $4.92x + $9,891 LSR method: y = 4.10x + $12,346 Patient days
Least Squares Regression Method Outlier? Nonlinear? Mixed Cost LSR method: y = 4.10x + $12,346 (with outlier) Patient days
Least Squares Regression Method Outlier? Nonlinear? Mixed Cost LSR method: y = 4.10x + $12,346 (with outlier) LSR method: y = 3.51x + $13,890 (without outlier) Patient days
Example: High-Low Method and Predicting Cost (P6-15) Prince Company’s total OH costs at various levels of activity are presented below:
Example: High-Low and Predicting Cost (P6-15) Assume OH costs consists of utilities, supervisory salary, depreciation, and maintenance. The breakdown for October at 80,000 DL hour level of activity is: The company wants the breakdown of costs into variable and fixed cost elements. Answer the following required:
Example: High-Low and Predicting Cost (P6-15) 1. Estimate how much of the $483,200 of OH cost in December was maintenance cost
Example: High-Low and Predicting Cost (P6-15) The company wants the breakdown of costs into variable and fixed cost elements. Answer the following required: Variable Cost = $104,000/80,000 * 140,000
It is Clicker Time!! Feel Free to Work Together on Clicker Questions
Clicker Question #1 (P6-15) Q: Use the high-low method to develop the cost formula for maintenance cost (select option that is closest to your answer). LOW (October): 80,000 DL hours @ $116,400 HIGH (December): 140,000 DL hours @ $181,200 • A. Y = $15,000 + $23.80X • B. Eggs + Plants = Eggplant • C. Y = $30,000 + $3.12X • D. Y = $30,000 + $1.08X • E. Y = $15,000 + $2.38X
Clicker Question #1 LOW (October): 80,000 DL hours @ $116,400 HIGH (December): 140,000 DL hours @ $181,200 $181,200 - $116,400 = 140,000 – 80,000 $64,800 = 60,000 = $1.08 per DL hour Then: Answer: D. Y = $30,000+$1.08X = $116,400 a + ($1.08 * 80,000) = a $30,000
Example: High-Low and Predicting Cost (P6-15) 3. Express the company’s total OH cost in the formula Y = a+ bX: Variable Costs: Utilities ($104,000/80,000 DL) $1.30/DL hour Maintenance $1.08/DL hour Total Variable $2.38/DL hour Fixed Costs: Salaries and depreciation $120,000 Maintenance $30,000 Total Fixed $150,000
Example: High-Low and Predicting Cost (P6-15) 3. Express the company’s total OH cost in the formula Y = a+ bX: Total Variable $2.38/DL hour Total Fixed $150,000 Y = $150,000 + $2.38X
The Contribution Format • Utilizes our ability to analyze cost behavior • An income statement format that separates expenses into fixed costs and variable costs • Differs from traditional presentation of COGS and operating expenses • Total cost is the same under both methods but only subtotals vary • Contribution margin • The amount remaining from sales after all variable costs have been deducted
Contribution Income Statement To Do: Analyze expense behaviour of the following and develop a contribution income statement:
It is Clicker Time! Feel Free to Work Together on Clicker Questions
Clicker Question #2 Q: Contribution margin equals revenues minus _______? • Product costs • Period costs • Variable costs • Fixed costs • 9 little monkeys jumping on the bed
Clicker Question #2: Answer Q: Contribution margin equals revenues minus _______? Answer: C. Variable costs
Clicker Question #3 Q: What is the contribution margin?
Clicker Question #3 Q: What is the contribution margin? • $37,250 • $100,000,000.23 • $ 87,000 • $176,000 • $262,750
Clicker Question #3: Answer Q: What is the contribution margin? Answer: • $37,250
UW … • UW is one of Canada’s leading research institution • The School of Accounting and Finance has one of the country’s premier PhD programs • Every year, I train PhD students in teaching. • So, the next 3 classes (Cost-Volume-Profit Relationships) will be taught by Kun Huo, one of our PhD students. • I will sit in the class as an observer.
Summary • Major topics for today… • Another example of High-Low Method • Contribution margin approach • Next class … • Chapter 7 (Cost-Volume-Profit Relationships)