Download
1 / 18
180 likes | 319 Vues
Why are Some Brightest Cluster Galaxies Forming Stars?. Christopher O’Dea Rochester Institute of Technology. The Spitzer BCG Project. Alice Quillen, Nick Zuffelt, Jaehong Park (Rochester) Stefi Baum, George Privon, Jake Noel-Storr (RIT) Alastair Edge, Richard Willman (Durham)

E N D
Why are Some Brightest Cluster Galaxies Forming Stars? Christopher O’Dea Rochester Institute of Technology
The Spitzer BCG Project • Alice Quillen, Nick Zuffelt, Jaehong Park (Rochester) • Stefi Baum, George Privon, Jake Noel-Storr (RIT) • Alastair Edge, Richard Willman (Durham) • Helen Russell, Andy Fabian, Carolin Crawford, Roderick Johnstone (Cambridge) • George Rieke, Eiichi Egami (Arizona) • Megan Donahue, Mark Voit (Michigan State) • Brian McNamara (Waterloo) • Steve Allen (Stanford) • Craig Sarazin (Virginia) • David Frayer (IPAC) • Paul Goudfrooij, Duccio Macchetto, Bill Sparks (STScI) • Joel Bregman (Michigan) • Main contributors are highlighted in yellow
Outline • Introduction • The Sample • Spitzer Observations • The Spectral Energy Distribution • Correlations • Summary & Implications
Introduction • Some form of feedback/heating seems necessary to explain the luminosity function of galaxies (e.g., Benson et al 2003; Binney 2004), and the lack of intermediate temperature gas in X-ray spectra of the ICM of “cool core” clusters (e.g., Peterson & Fabian 2006). • Star formation is likely to be the ultimate sink for any cooling gas and thus provides a constraint on the ability of heating to stop catastrophic cooling in the ICM. • Thus, we undertook a census of star formation in Brightest Cluster Galaxies (BCGs) using Spitzer.
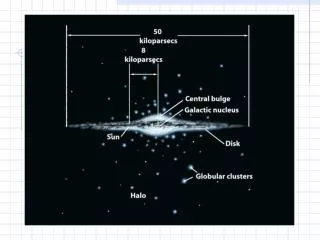
The BCG Sample • 70 BCGs selected on Cluster X-ray and BCG Hα emission • Two samples from ROSAT All Sky Survey • Brightest Cluster Sample (Ebeling et al 1998, 2000) • REFLEX (Bohringer et al 2004) • Added PKS0745-191 and A11 so that all CO detected BCGs have Spitzer data • Detection in Hα (Crawford et al. 1999) • Egami et al (2006)’s small sample had suggested that only BCGs with optical line emission show an IR excess • The selection tends to favor BCGs in “cool core” clusters • Data for 62 sources analyzed so far
The Spitzer Observations • IRAC Imaging 3.6, 4.5, 5.8, and 8 µm • 12 sec frame time, 9 position random medium step dither; 108 sec total integration time • Fluxes extracted in aperture of 12.2 arcsec diameter • MIPS Imaging 24 and 70 µm • 3 cycles of 10 sec • Fluxes extracted in aperture of diameter 24 and 35 arcsec, respectively
BCG SEDs • ~1/3 have an IR excess • F8µm/F5.8µm > 0.75 and/or detection at 70 µm • 4 sources are likely AGN dominated in the IR (A1068, A2146, Zw2089, R0821+07) • We suspect the IR excess in the non-AGN BCGs is powered by star formation. Observed SEDs of the 62 BCGs, grouped by color. (Top Left). 3 BCGs likely AGN dominated. (Top Right). F8µm/F5.8µm > 1.3, all detected at 70µm. (Left Middle). 0.98 < F8µm/F5.8µm < 1.3. (Right Middle). 0.75 < F8µm/F5.8µm < 0.98. (Left and Right Bottom). F8µm/F5.8µm < 0.75.
Correlation between 24/8 µm and 5.8/3.6 µm Colors • The two colors are correlated, though 24/8 has larger scatter. • BCGs with colors 5.8/3.6 > 0.5 or 24/8 > 1 have an IR excess • The 3 BCGs in the top right are likely AGN dominated. The three clusters in the top right are A1068, A2146, and Z2089 which have unresolved red nuclear sources and a high [OIII]/Hβ ratio.
High Lx Seems Necessary but not Sufficient for a BCG IR Excess • BCGs with an IR excess are found mainly at high cluster X-ray luminosity (Lx > 1044 ergs/s). • But not all high Lx clusters have a BCG with IR excess Cluster X-ray luminosity is from ROSAT 0.1-2.4 keV fluxes using Ho = 70 km/s/Mpc
X-ray and Infrared Luminosity • BCGs with redder 8/5.8 µm colors have larger IR luminosity. • IR luminosities lie in the range 1043 to few x 1045 ergs/s • 9 objects, including the 4 AGN are LIRGs, (LIR > 1011 L☼) • No correlation between BCG IR luminosity and cluster X-ray luminosity. • SN cannot account for X-ray luminosity. X-ray vs. IR luminosity for the BCGs with an IR excess. We interpolate between 8 and 24 µm to estimate the 15 µm flux and then estimate the total IR luminosity following Elbaz et al (2002). Assuming the IR luminosity is produced by star formation, we calculate the KE injected by SN, shown as the line.
Correlation of Hα and IR Luminosity • Hα luminosity is proportional to IR luminosity. • Consistent with both Hα and IR powered by star formation. • Hα luminosity sits below the Kennicutt relation, probably due to aperture effects. Hαvs. IR luminosity for the BCGs with an IR excess. Assuming the IR luminosity is produced by star formation, we calculate the expected Hα luminosity powered by star formation (following Kennicutt 1998) shown as the line. Note that 8µm is measured in a 12.2” diameter aperture, while the Hα is measured with a 1.3” slit (Crawford et al. 1999).
Radio and IR Luminosity • Radio luminosity sits above the star formation relation, consistent with radio powered by AGN. • No strong correlation between radio and IR luminosity. • Feedback mechanism does not produce strong coupling between star formation and fuelling AGN? • Star formation and AGN fuelling on different time scales? • Radio luminosity is not a good measure of AGN feedback? Radio vs. IR luminosity for the BCGs with an IR excess. Radio flux densities are from FIRST and NVSS. The radio-IR relation for star forming galaxies is shown as the line (from Bell 2003).
Correlation of Molecular Gas Mass and IR Luminosity • Mass of molecular gas is correlated with the IR luminosity. • Star formation heats molecular gas making CO visible? • Molecular gas does not accumulate in BCGs without forming stars? Molecular gas mass from CO observations (Edge 2001, and in preparation) vs. estimated IR luminosity for the BCGs with an IR excess.
Correlation of Molecular Gas Mass and Star Formation Rate • Mass of molecular gas is correlated with the star formation rate (as expected due to the correlation with IR luminosity). • Our data are consistent with a Schmidt relation for a star forming region diameter of 16 kpc. This is roughly consistent with sizes estimated in the IRAC images. Molecular gas mass from CO observations (Edge 2001, and in preparation) vs. estimated star formation rate (SFR) for the BCGs with an IR excess. We estimate the SFR from the IR luminosity following Bell (2003). The Schmidt-Kennicutt relation between SFR per unit area and molecular gas surface density is plotted for star forming diameters of 10, 16, and 25 kpc.
Correlation of Mass Accretion Rate and Star Formation Rate • The estimated mass accretion rate from cooling gas is proportional to the estimated star formation rate. • However, the SFR is a factor of 10-100 smaller than the mass accretion rate. • This suggests that heating almost completely balances cooling. Mass accretion rate from a cooling flow (i.e., in the absence of any heating) vs. estimated star formation rate (SFR) for the BCGs with an IR excess. The mass accretion rate was calculated using archival Chandra, XMM, and ROSAT-PSPC observations. X-ray spectra were extracted for the central 100 kpc radius region and fitted using XSPEC with a single Temperature MEKAL model and a photoelectric absorption model. We estimate the SFR from the IR luminosity following Bell (2003). The three sources to the far right are likely AGN dominated.
Summary • We present Spitzer observations of a sample of 62 BCGs selected on cluster X-ray flux and BCG Hα flux; favors “cool core” clusters. • ~1/3 of the BCGs show an infrared excess (LIR ~ 1043 to few x 1045 ergs/s; 9 objects (including 4 AGN dominated sources) are LIRGS. • The IR luminosity is proportional to the Hα luminosity, consistent with star formation powering the IR and Hα. • The infrared excess in non-AGN BCGs is probably due to star formation with rates of ~1-50 solar masses per year. • The SFR is proportional to the mass of molecular gas and is consistent with a Schmidt law with a characteristic diameter of the star forming region of ~16 kpc. • The SFR is proportional to the X-ray derived (100 kpc scale) mass accretion rate from cooling gas; though the SFR is 10-100 times less than the estimated mass accretion rates.
Implications • Most BCGs are not actively forming stars at the current epoch. • The BCGs which do form stars tend to be in “cool core” clusters with high Lx and LHα. • Star formation is not an essential feature of the feedback process – it does not occur in all cool core clusters, and is not energetically important to the ICM, though it likely powers the optical line emission. • The low SFR relative to the X-ray derived mass accretion rate is consistent with the hypothesis that heating is generally successful in stopping catastrophic cooling in the cool core clusters.