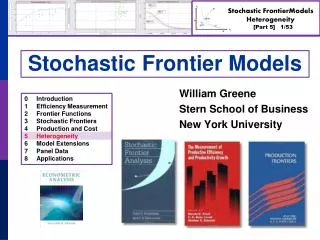
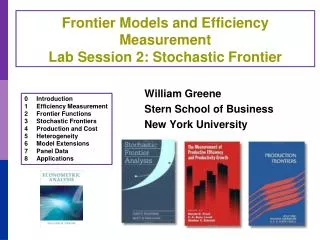
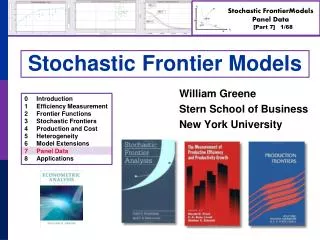
Stochastic Frontier Models
William Greene Stern School of Business New York University. Stochastic Frontier Models. 0 Introduction 1 Efficiency Measurement 2 Frontier Functions 3 Stochastic Frontiers 4 Production and Cost 5 Heterogeneity 6 Model Extensions 7 Panel Data 8 Applications.

Stochastic Frontier Models
E N D
Presentation Transcript
William Greene Stern School of Business New York University Stochastic Frontier Models 0 Introduction 1 Efficiency Measurement 2 Frontier Functions 3 Stochastic Frontiers 4 Production and Cost 5 Heterogeneity 6 Model Extensions 7 Panel Data 8 Applications
Main Issues in Panel Data Modeling • Issues • Capturing time invariant effects • Dealing with time variation in inefficiency • Separating heterogeneity from Inefficiency • Examining technical change and total factor productivity growth • Contrasts – Panel Data vs. Cross Section
Technical Change • Technical Change • LnOutputit = f(xit,zi,,t) + vit - uit. • LnCostit = c(xit,zi,,t) + vit+ uit. • Independent of other factors, TC = f(..)/t • Change in output not explained by change in factors or environment – shift in production or cost function • Time shift the goal function. Lnyit= xit+zi + t + vit - uit.
Familiar RE and FE Models Wisdom from the linear model • FE: y(i,t) = f[x(i,t)] + a(i) + e(i,t) • What does a(i) capture? • Nonorthogonality of a(i) and x(i,t) • The LSDV estimator • RE: y(i,t) = f[x(i,t)] + u(i) + e(i,t) • How does u(i) differ from a(i)? • Generalized least squares and maximum likelihood • What are the time invariant effects?
A Frontier Model for Panel Data • y(i,t) = β’x(i,t) – u(i) + v(i,t) • Effects model with time invariant inefficiency • Same dichotomy between FE and RE – correlation with x(i,t). • FE case is completely unlike the assumption in the cross section case
The Panel Data Models Appear: 1981 Time fixed
Stochastic Frontiers with a Rayleigh Distribution Gholamreza Hajargasht, Department of Economics, University of Melbourne, 2013
Rayleigh vs. Half NormalSwiss Railway Data Rayleigh Half Normal
Reinterpreting the Within Estimator: 1984 Time fixed
Schmidt and Sickles FE Model lnyit= + β’xit + ai+ vit estimated by least squares (‘within’)
Variations on Battese and Coelli • (There are many) • Farsi, M. JPA, 30,2, 2008.
Are the time varying inefficiency models more like time fixed or freely time varying?
Greene, W., Distinguishing Between Heterogeneity and Inefficiency: Stochastic Frontier Analysis of the World Health Organization’s Panel Data on National Health Care Systems, Health Economics, 13, 2004, pp. 959-980.
True Random and Fixed Effects: 2004 Time varying Time fixed
Skepticism About Time Varying Inefficiency Models: Greene (2004)
Schmidt et al. (2011) – Results on TFE • Problem of TFE model – incidental parameters problem. • Where is the bias? Estimator of u • Is there a solution? • Not based on OLS • Chen, Schmidt, Wang: MLE for data in group mean deviation form
Moving Heterogeneity Out of Inefficiency World Health Organization study of life expectancy (DALE) and composite health care delivery (COMP)
A Stochastic Frontier Model with Short-Run and Long-Run Inefficiency: Colombi, R., Kumbhakar, S., Martini, G., Vittadini, G.University of Bergamo, WP, 2011
Tsionas, G. and Kumbhakar, S. Firm Heterogeneity, Persistent and Transient Technical Inefficiency: A Generalized True Random Effects Model Journal of Applied Econometrics. Published online, November, 2012. Forthcoming. Extremely involved Bayesian MCMC procedure. Efficiency components estimated by data augmentation.
Kumbhakar, Lien, Hardaker Technical Efficiency in Competing Panel Data Models: A Study of Norwegian Grain Farming, JPA, Published online, September, 2012. Three steps based on GLS: (1) RE/FGLS to estimate (,)(2) Decompose time varying residuals using MoM and SF. (3) Decompose estimates of time invariant residuals.
247 Farms, 6 years. 100 Halton draws. Computation time: 35 seconds including computing efficiencies.
43 Cost Efficiency of Swiss Railway Companies: Model Specification C = f ( Y1, Y2, PL , PC , PE , N, DA ) C = Total costs Y1 = Passenger-km Y2 = Freight ton-km PL = Price of labor (wage per FTE) PC = Price of capital (capital costs / total number of seats) PE = Price of electricity N = Network length DA = Dummy variable for companies also operating alpine lines
44 Data 50 railway companies, Period 1985 to 1997 Unbalanced panel with number of periods (Ti) varying from 1 to 13 and with 45 companies with 12 or 13 years, resulting in 605 observations Data source: Swiss federal transport office Data set available at http://people.stern.nyu.edu/wgreene Data set used in: Farsi, Filippini, Greene (2005), Efficiency and measurement in network industries: application to the Swiss railway companies, Journal of Regulatory Economics
Model Specifications: Special Cases and Extensions Pitt and Lee True Random Effects Extended True Random Effects Mundlak correction for the REM, group means of time varying variables Extended True Random Effects with Heteroscedasticity in vit: v,it=vexp(’zit)
46 Efficiency Estimates TRE Models Move HeterogeneityOut of the InefficiencyEstimate
47 2. Cost Efficiency of Norwegian Electricity Distribution Companies: Model Specification C = f ( Y, CU, NL, PL , PC ) C = Total costs of the distribution activity Y = Output (total energy delivered in kWh) CU = Number of customers NL = Network length in km PL = Price of labor (wage per FTE) PC = Price of capital (capital costs / transformer capacity)
48 Data 111 Norwegian electricity distribution utilities Period 1998 – 2002 Balanced panel with 555 observations Data source: Norwegian electricity regulatory authority (Unpublished)
Mundlak Specification Suggests ei or wi may be correlated with the inputs.
50 Efficiency Estimates