Download

1 / 36
360 likes | 476 Vues
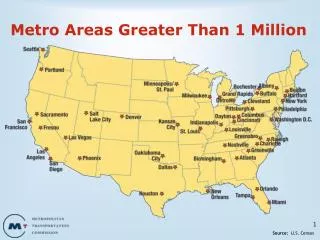
Close to Home Indiana and its Metro Areas. Jerry Conover, Carol Rogers & Michael Thompson Indiana Business Research Center Kelley School of Business, Indiana University. Indiana Outlook: A long, slow road ahead. National slowdown challenges Indiana’s efforts to grow

E N D
Close to HomeIndiana and its Metro Areas Jerry Conover, Carol Rogers & Michael Thompson Indiana Business Research Center Kelley School of Business, Indiana University
Indiana Outlook: A long, slow road ahead • National slowdown challenges Indiana’s efforts to grow • Our economy has grown more slowly than the nation’s for several years, but the gap is narrowing • Overall outlook: • a tough year in 2008 • slow growth in 2009 • more robust growth in 2010
Key Indiana sectors: Motor Vehicle Mfg. The nation is losing auto plant jobs at a faster rate than Indiana.
Key Indiana sectors: Construction • Indiana bucked the national trend last year. • But residential slowdown and tight money have kicked in lately.
Key Indiana sectors:Professional & Business Services • Sector still growing, but much more slowly in recent months. • Professional, scientific & technical services doing OK. • Management of companies & enterprises not growing.
Households more stressed in other states HESI = unemployment rate + inflation rate – % change in house prices • 28 states have higher HESI than Indiana • Indiana housing prices still rising • Unemployment relatively low here
Forecast for Indiana: Employment IU Center for Econometric Model Research Several more months of weak employment before turnaround: • Payroll jobs shrink by 32K in 2008, then gain 8K in 2009 and 46K in 2010. • Non-payroll jobs keep growing through 2010, gaining 28K this year.
Indiana Forecast: Personal Income Growth IU Center for Econometric Model Research
Indiana is not all the same. Many regions are adding jobs & lowering unemployment… …while others are not.
Most, but not all, MSAs will add jobs IU Center for Econometric Model Research
Cities will also vary in income growth IU Center for Econometric Model Research
Kokomo, Muncie to Lead Sales Growth economy.com
Broad slowdown in building permits economy.com
New Job Commitments by International Businesses in Indiana, 2005–2007
THE OFT-POSED QUESTION: WHY IS INDIANA’S PER CAPITA PERSONAL INCOME LOWER THAN THE U.S. AND MANY STATES?Indiana Department of Workforce DevelopmentQuarterly Economic Briefing Indiana Business Research Center Jerry N. Conover, Ph.D., Director Carol O. Rogers, Deputy Director
Indiana’s Per Capita Personal Income Compared to the Midwest
What Explains Indiana’s PCPI? • Hypothesis1: Earnings comprise the largest component of personal income, ergo earnings drive income and as a result, the occupational structure of Indiana’s economy may help explain Indiana’s PCPI performance. • The Question: how strong is the relationship between average annual earnings for the 22 major occupation categories and the concentration in those occupations?
Correlation: Average Annual Earnings and the Concentration of Occupations
Occupational Trends Help Explain Rate of Income Growth • Hypothesis2:High-wage, high-growth occupations drive larger increases in personal income and faster rates of PCPI growth. • Question: What is the relative concentration of occupations in higher PCPI states?
Relationship between Earnings and Occupations for Illinois Positive relationship between occupation concentration and average annual earnings
Relationship between Earnings and Occupations for Indiana Negative relationship between occupation concentration and average annual earnings
Concentration and Earnings of Management Occupations in the Midwest Indiana: Increasing
Concentration and Earnings of Life, Physical and Social Science Occupations in the Midwest Indiana: Increasing
Occupations Driving Indiana’s PCPI Performance Indiana currently has a higher concentration in occupations with slower earnings growth
Concentration and Earnings of ProductionOccupations in the Midwest Indiana: Increasing (and leads the pack)
Concentration and Earnings of Transportation and material handlingOccupations in the Midwest Indiana: Increasing Indiana
Occupations Driving Indiana’s PCPI Performance While earnings per job are increasing in these key occupations, Indiana has lost concentration in 3 of these 4
Comparing the Concentration and Earnings of Healthcare practitioners and technical Occupations in the Midwest Indiana: Decreasing
Comparing the Concentration and Earnings of Business and Financial Operations Occupations in the Midwest Indiana: Decreasing But earnings growth is slightly above the U.S. and most of the Midwest.
Further Research This “50,000 foot” analysis shows that Indiana’s occupational mix can explain the wage & salary component of Indiana’s PCPI performance. Further questions remain: • Does the occupational make-up by industry also account for overall income differences between states? • What other factors can we determine directly effect PCPI (and wages)? • labor force participation rates • demographic shifts (e.g. aging and migration) • How does a lower cost of living affect wages? • policy (e.g., taxes, minimum wage)
Try this at home • Want to try this at home? • The following slides provide the tools …
The Data • Per Capita Personal Income is a measure of all forms of income, including dividends, benefits, transfer payments and BEA imputations • Divided by all state residents to create a comparable statistics • Average Earnings by Occupation only considers gross salary or wages for those holding jobs at UI-covered establishments • It is not “fully loaded” with benefits or supplements • It doesn’t include overtime pay • The two measures are different, but are highly correlated
Calculating LQ The Location Quotient (LQ) % state employment in given occupational group % Midwest employment in given occupation group = LQ score of greater than one (> 1): a higher concentration of a state’s employment relative to other Midwestern states LQ score of less than one (< 1): a lower concentration of a state’s employment relative to other Midwestern states