The Impact of the 2008-09 Global Crisis on Commodity-Dependent Low-Income Countries
Explore the relevance of the poverty trap concept in low-income commodity-dependent countries post the 2008-09 global crisis. Analyze the implications of price volatility, market structures, and growth trajectories in these vulnerable nations.

The Impact of the 2008-09 Global Crisis on Commodity-Dependent Low-Income Countries
E N D
Presentation Transcript
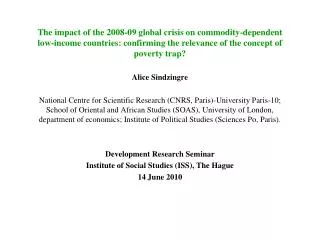
The impact of the 2008-09 global crisis on commodity-dependent low-income countries: confirming the relevance of the concept of poverty trap? Alice Sindzingre National Centre for Scientific Research (CNRS, Paris)-University Paris-10; School of Oriental and African Studies (SOAS), University of London, department of economics; Institute of Political Studies (Sciences Po, Paris). Development Research Seminar Institute of Social Studies (ISS), The Hague 14 June 2010
1. Context, questions • Many low-income countries = commodity-exporters, and many commodity-exporters = commodity-dependent countries=> impact of the crisis on countries exhibiting this specific market structure? • = the most vulnerable to price volatility and fluctuations of global demand for their exports - fuels, mineral or agricultural products. • This volatility is an intrinsic feature of commodities: amplified during the 2003-08 commodity boom by the increasing linkages between commodities and financial markets: commodities traded as financial assets. • Back to theories of the secular decline of commodity prices (R Prebisch, H Singer, A Maizels): this volatility ensnares low-income countries and explains slow growth. • + concept of the poverty trap: feedback processes, increasing returns, spillovers, multiple equilibria, irreversibility, threshold effects... • => difficult for low-income countries to reach the ‘tipping point’ above which they can trigger long-run growth .
Controversies: • Poverty traps reinforce themselves through endogenous processes: low productivity, low value-added , export of commodities, representing a decreasing share of unit of GDP due to technological progress (World Bank , 2009a) • But for other studies,different conceptual frameworks: e.g., growth accelerations-decelerations, no ‘traps’ for commodity-dependent countries • + industrial and emerging countries need certain commodities as inputs for their industries => demand for these commodities, and therefore prices, follows cycles can be investigated without the concept of trap. • The paper: a theoretical analysis of the concept of the poverty trap • Focus on low-income commodity-dependent SSA countries • Argument: these countries growth trajectories confirm the relevance of the conceptual framework of poverty traps. • The 2008-09 crisis, another commodity boom, then slump (then boom?), the most severe recession in 50 years =example of the processes underlying the concept of ‘trap’.
Outline • 1. Key theoretical features of the concept of poverty traps • 2. Market structures of commodity dependence and price volatility have long been viewed as key factors of poverty traps, + deepening of the linkages between commodity and financial markets over 2003-08. • 3. Theoretical critiques regarding the very existence of poverty traps: competing explanations of poor countries’ growth profiles. • 4. Against these critiques: explanatory power of the concept of poverty traps; commodity-dependent countries’ growth trajectories exhibit the definitional features of traps: low equilibria, diverging paths relatively to other groups of countries, threshold and lock-in effects. • 5. The assessment of causalities does not mean determinism: other factors combine with the relationship between commodity-dependence and growth, which counter or reinforce the formation of traps: in particular, domestic institutions.
2. What is a poverty trap? The concept’s main features • Low equilibria, cumulative causation, lock-in processes • Poverty trap: irreversibility, lock-in devices, multiple equilibria (high and low), threshold effects, non-linearity, increasing returns. • Multiple equilibria or ‘traps’: B Arthur (1989, 1994a): positive feedbacks, path dependence, “lock-in by historical small events”, self-reinforcing mechanisms, cumulative causation, some equilibria able to lock in economies or individuals in inefficient behaviour and low levels of income. • Increasing returns in growth, e.g., A Young (1930s), N Kaldor (1950s). • B Arthur: dynamic nature of increasing returns and positive feedbacks, their stochastic character = random deviations from long-run tendencies • This property => multiple long-run states depending on initial conditions and random fluctuations, and of ‘specialised’ outcomes (e.g. in geographical terms). • Individual level => learning, experience and the perception of success may lead to the reinforcement of some processes, e.g., the transmission of some information at the expense of others: such processes lock individuals in inefficient behaviour. • => even with suitable initial conditions, the same mechanisms can lead to either optimal or inefficient equilibria.
Lock-in (e.g. by technological choices) and positive feedback => path dependence (David, 1985, 2000) = phenomena that have the dynamic property of non-ergodicity in stochastic processes (i.e. not having the “ability eventually to shake free from the influence of their past states”), and which, beyond market failures and inefficiencies, imply the existence of “winners and losers”. • P David (2000) :‘lock-in’ = the “entry of a system into a trapping region” • = the basin of attraction that surrounds a locally (or globally) stable and self-sustaining equilibrium. • A dynamic system that enters into such regions needs, in order to escape from it, external forces that alter its structure. • Locked-in equilibria may be optimal or detrimental • P David: whatever the equilibrium, individuals are happy doing something, “even though they would be happier doing something else if everybody would also do that other thing too”, because incomplete information prevent them from coordinating and moving elsewhere collectively. • Alternatives paths are possible: path dependence does not mean determinism.
The recognition of traps in growth theories • Some growth models: when jointly considering income and growth rate, non-linearity, multiple equilibria=salient feature of the growth process (Fiaschi-Lavezzi, 2003) • Kelly (2001): Schumpeterian growth models: development =progress through a space of commodities, from simple to complex goods (linkage formation) =>thresholds: below a critical probability of linkage formation, development ceases; above, innovation continues. • Concepts of polarisation and ‘club convergence’ (Azariadis, 2006): against assumptions of growth convergence across countries to similar steady-state income levels, and explanations of variations in income growth by different initial conditions. History (past events have large and lasting effects); non-linearity and lock-in constraints on the growth of certain countries. • Global inequality: different growth patterns: ‘hills’, ‘plateaux’ (Pritchett, 1997; 2000), multiple equilibria explaining the income gap between rich and poor countries (Graham and Temple, 2006).
Figure 1: relative GDP levels vs. growth rates Source: Fiaschi and Lavezzi (2003), based on the Penn World Table 5.6 for the 1960-1989 period for 120 countries. GDP = relative income with respect to the (world) average of the period.
Spillovers and coordination failures as causes of underdevelopment traps • WWII theorists : G Myrdal, A Hirschman, P Rosenstein-Rodan (1943): why some economies are unable to trigger the virtuous process of catching-up? • => spillover effects, linkages and complementarities: cf. cumulative causation and path dependency. • Rosenstein-Rodan: spillovers = increasing returns to an activity proportional to the number of others who undertake the same activity. Lack of spillovers, coordination failures =>traps. • Low equilibria, coordination failures and poverty traps are endogenous and self-reinforcing. • => markets alone cannot achieve the coordination necessary for triggering development (Adelman, 2000; 2001). Markets do not necessarily lead from the lowest equilibrium to the best one (Hoff, 2000). • => hence at the early stages of development, the state= the entity most able to reallocate factors and resources across markets=> ‘big push’ (Murphy et al., 1989). • State capacity is endogenous to the level of development (Bardhan and Udry, 1999) => underdevelopment traps are likely at early stages of development, their determinants being economic, political, institutional.
Barrett and Swallow (2006): standard growth models = a single dynamic equilibrium => convergence of growth paths toward a single level of welfare Figure 2: Welfare dynamics under the convergence hypothesis. Source: Barrett and Swallow (2006).
Multiple dynamic equilibria => S-shape of the growth function, with stable dynamic equilibria at high and low levels of welfare (Wh, Wl), => at least one unstable dynamic equilibrium, a critical threshold (Wc). Only a large positive shock make economies or households able to escape the basin of attraction of the low-level equilibrium ,move toward a higher equilibrium. Figure 3: Welfare dynamics under the poverty traps hypothesis. Source: Barrett and Swallow (2006)
3. A key determinant of poverty traps in low-income countries: commodity dependence • Low-income countries as commodity-dependent countries • Most low-income developing countries: dependence on commodities for their exports and lack of economic diversification. • E.g., in SSA, since the mid-2000s, fuels represent more than half of exports (IMF, 2007, table 4.1). • Commodity dependent countries: undiversified export structure.
Table 1: Commodity dependence by geographical region, 1995–1998; 2003–2006 (nb. countries where exports of commodities = more than 50% of total exports) Source: UNCTAD (2008b), table 2.4.
Vulnerability of export-oriented countries to external demand: • Figure 4: elasticity of world trade to world income by decade Source: IMF, World Economic Outlook, October 2009
The long-term decline in commodity prices • Correlation between stagnation and commodity dependence • R Prebisch, H Singer: secular decline in world real prices of commodities and the deterioration in the terms of trade/ToT of commodities vis-à-vis manufactures • => industrialisation, as productivity and technical progress = key factors of growth (Prebisch, 1959). • Maizels (1984, 1987): over the long term, the trend in the commodity terms of trade deteriorates: 3 key factors: • the low price-and-income-elasticities of demand for commodities vis-à-vis manufactures; • the technological superiority of developed countries and the economic power of their transnational corporations, which allows these countries to capture excess profits in trade with underdeveloped areas; • the asymmetrical impact of labour union power in developed countries and labour surplus in developing countries on the division of the benefits of increased productivity.
Negative relationship growth-primary products found within developed countries, e.g., across regions within the US (Papyrakis and Gerlagh, 2007). • Composite index of commodity prices of TheEconomist: continuous decline since 1845: in 1999, the industrial commodities index had fallen to a record low in real terms: 80% below its level in 1845 (1845-50=100, and 1999=20) (The Economist, 1999). Over 1862-1999, Cashin and McDermott (2002): downward trend in real commodity prices by 1% per year over that period + no break in this long-run trend. • IMF (2009a): over the long-run, prices for many commodities have declined relative to those of manufactures and services. • However, this trend is questioned: commodity prices explained by periodic structural breaks (Grilli and Yang, 1988) . • IMF (2009a): the secular decline stems from productivity gains in the commodity sectors;many commodities’ share in total consumption declines as income increases: but rates of decline vary across commodities (available reserves, industry structure, demand characteristics, etc). Oil: exception in the decline: oligopolistic supply structure, concentration of reserves.
Figure 5: The Economist composite index (The Economist, 15th April 1999)
Volatility as a key characteristic of commodity prices • Commodity-dependent countries to be caught in poverty traps, because of commodity price volatility. • The more a country is dependent on commodities for exports, the more relative prices (between tradable and non-tradable) may become volatile (Hausmann and Rigobon, 2002). • Volatility demonstrated on an historical scale. Cf Cashin and McDermott (2002): the Economist’s composite commodity price index over 1862-1999: • “ratcheting-up” in the variability of price movements; increasing amplitude of price movements in the early 1900s; increasing frequency of large price movements after the collapse of the Bretton Woods regime of fixed exchange rates (early 1970s). • the downward trend in real commodity prices “completely dominated by the variability of prices”.
Helbling et al. (2009): despite the integration of commodity markets, commodity price fluctuations dominated by the prices of a few commodities: the 2002-08 price boom = energy and metals price boom, prices tripled between mid-2002 and mid-2008. Metals prices follow demand fluctuations (global industrial cycle). Second half of 2008: sharp drop: energy prices declined by 70%, metals prices, 50%; food prices, by 30%. Figure 6: historically, commodity prices have been volatile and subject to large swings (real commodity prices, constant U.S. dollars, 1990=100) Source: Helbling et al. (2009)
Figure 7: Confirmed at a secular scale … Source: Streifel (2006)
Increasing vulnerability due to the linkages between markets • Integration of commodity markets among themselves, and of commodity and financial markets. • Maizels (1984, 1987): intrinsic instability of commodity markets. • Maizels (1994): ‘financialisation’ of commodity markets • Increasing role of the financialisation in the 2000s in price volatility: impact of derivative markets on price volatility (Nissanke, 2009). • ‘International poverty traps’: low productivity, debt traps =>combination of international trade and finance relationships reinforces the cycle of stagnation, which, in turn, reinforces the negative impact of external relationships. • UNCTAD (2002): closer linkages between energy and agricultural commodity markets, as well as commodity and financial markets over the 2000s. • => increase in price volatility and therefore uncertainty, detrimental effect on investment and governments’ financial management (UNCTAD, 2008b; Sindzingre, 2009).
4. Is commodity-dependence an effective cause of traps? The criticisms of commodity-based poverty traps • Many arguments against the concept of poverty trap: • i) if traps exist, they may be generated by many other factors than commodity-based market structures; • ii) commodities do not always generate traps; • iii) the very existence of poverty trap may be questioned. • Lack of correlation between commodity-based export structures and traps: traps caused by factors unrelated to commodities • Critiques of commodity-generated traps: 2 arguments. • 1) the lack of convergence between groups of countries -a group growing more slowly relatively to other countries- is caused by many other factors.
Poverty traps may result from poor public policies: e.g., protection • Or from initial economic conditions: e.g., low savings rates as the latter depend on the level of per-capita income, or credit market imperfection and borrowing constraints (Banerjee and Newman, 1994). • Azariadis and Drazen (1990): ‘low growth traps’ or ‘underdevelopment traps’, i.e. multiple and stable equilibria for economies exhibiting similar initial conditions, result from ‘threshold externalities’ created by increasing returns in the accumulation of human capital. • Azariadis (1996): why similar countries do not converge to the same steady state? Many causes of poverty traps: subsistence consumption, limited human capital, demographic transitions when fertility is endogenous (as in SSA), political economy problems such as coordination failures among voters. • Azariadis (2006): non-ergodic growth theory: ‘misbehaving governments’ and incomplete markets = determinants of poverty traps.
Explaining per capita income at the individual or household level: microeconomic poverty traps stem from spatial processes (Benabou, 2000). • spatial poverty traps (Durlauf, 2003): dynamic, as the residence restricts future opportunities: if composed initially of poor members, a group will remain poor over generations = self-reinforcing processes: low level of education, poor schooling infrastructure, low levels of taxes, limited supply of public goods. • Decision for an individual to acquire an education depends on the prior existence of other educated members in a group: interdependence of behaviour => ‘neighbourhood effects’ generate different types of groups that have different steady states (with/without educated members) (Durlauf, 1996; 2003). • Intertemporal interdependence: it affects future social interactions: dynamics => persistent income inequality=reciprocal feedbacks micro/macro levels, mutually reinforcing. • Jalan and Ravallion (1997): does residence make the difference between growth and contraction in living standards for otherwise identical households? Spatial poverty traps and geographic externalities= neighbourhood endowments of physical and human capital influence the productivity of a household's own capital (cf. Hoff, 2000, China’s ‘local underdevelopment traps’).
Lack of correlation: the export of commodities as a basis for sustained growth • 2) 2nd argument against commodity-generated traps: many commodity-exporting countries enjoyed an increase in their per capita income, not caught in a poverty trap + grounded growth on primary products, e.g., Australia (metals), New Zealand (agricultural products), Canada, Scandinavian countries... • Many developed countries have based their industrialisation on natural resources. • Wright (1990): rise of US manufacturing in the 1890s associated with a rise in the resource intensity of exports (natural gas, petroleum, copper); natural resource abundance lowered input prices => fostered industrial production (steel products,) => increase in manufactured exports.
The irrelevance of the very concept of trap • Critique of the concept of commodity-based traps: problems of commodity-exporting countries are well-explained by more powerful theories: e.g., Dutch disease; ‘resource curse’. • Moreover, irrelevance of the concept of trap for analysing growth trajectories. • = Price profiles in commodity markets follow both trends and cycles (Cashin and Mc Dermott 2002), or ‘supercycles’. • A cycle is not a trap: over the long-run, SSA growth has moved closely with global real GDP growth: with the slowing of global growth, SSA exports are affected by lower external demand and declines in commodity prices (IMF, 2009b). • Chang and Helbling (IMF, 2009a): long-term trends in commodity prices are not relevant to the understanding of medium term price fluctuations: rates of change are highly variable and the trend component shifts over time, reflecting changes in longer-run price determinants (e.g., costs of marginal fields or mines) => price fluctuations reflect those in the trend component or those in the cyclical component.
Concept of poverty trap challenged by growth ‘acceleration’ / ‘deceleration’ • Hausmann et al. (2005): turning points in growth performance. Rapid acceleration = growth sustained for at least 8 years; 80 episodes since the 1950s. • Growth accelerations correlated with increases in investment and trade, and real exchange rate depreciations. • external shocks produce short-lived growth accelerations • growth accelerations are highly unpredictable • growth ‘decelerations’, or ‘growth collapses’ do not imply poverty traps. • Saba Arbache and Page (2007a): 44 SSA countries, 1975 -2005: low and volatile growth since 1975, but no evidence that growth volatility is associated with economic performance over the long run. But turning point in SSA growth in the 1990s and the possible formation of clubs. • Saba Arbache and Page (2007b): growth accelerations-decelerations in SSA, 1975-2005: no evidence that growth volatility has a relationship with long-term economic performance: many growth accelerations and as many growth collapse episodes, which offset the previous ones. • Interestingly (confirming traps?): growth accelerations-decelerations have an asymmetric impact on human development outcomes.
Figure 8: GDP per capita and growth rate (constant international $, PPP and non-PPP) Source: Saba Arbache and Page (2007a).
Easterly et al. (1993): ToT shocks explain a large part of the variance in growth, but fluctuations of growth rates do not necessarily build a poverty trap, and these fluctuations do not predict what long-run performance and per capita income will be: global technological change determines long-run growth, while country characteristics determine relative income levels. • Easterly (2005): the concept of poverty trap is irrelevant: in SSA, over the last 50 years, levels of income per capita have increased slowly despite high fluctuations in terms of growth rates. Poverty traps in the sense of zero growth for low income countries rejected by the data in most time periods. Divergence between rich and poor nations in the long run does not imply zero growth for poor countries. • Kraay and Raddatz (2005): no evidence of traditional determinants of poverty traps:low savings, low technology, low productivity in low-income countries => no ‘unfavourable initial conditions’: poverty depends on policies.
5. The concept’s explanatory power: recognising its definitional features in commodity-dependent countries • The relevance of traps’ 3 main definitional features: low equilibria, cumulative causation, lock-in and threshold effects • 1) the critiques of the concept of poverty traps overlook the definitional features and properties of the concept= poverty traps refer to growth processes that are non-linear, subject to cumulative causation, increasing returns, multiple equilibria and threshold effects. • P Arthur, P David: ‘small events’ may induce large effects that may be irreversible. • Key features = path dependence, irreversible processes (weight of history), lock-in processes - economies being attracted within a low equilibrium, and their dynamic consequences, e.g. self-reinforcing lock-in, stabilisation, etc., which make the reaching of a higher-growth path more costly. • This is why a trap cannot simply be assimilated to growth rates movements such as decelerations, or fluctuations • 2)the concept of trap = processes that are dynamic and relative to other countries’ dynamics: countries caught in low equilibria, trapped in basins of attraction (in terms of growth, efficiency) that are lower than in other countries.
Do commodity-dependent low-income countries exhibit these definitional features? • Low equilibria trapping commodity-dependent countries • UNCTAD (2008a) dependency rate = average share of the 4 main commodity exports value/value of total exports for the period 2003–2005. Dependency rate > 50% => more than 50% of earnings from exports come from the 4 commodities: more than half of all developing countries rely on 4 commodities for 50% of their exports earnings; 31% rely on 4 commodities for more than 75% of their export earnings. • Relationship with low per capita income: among the 45 LDCs, 30 =dependency rate > 50%; in Africa, 34 of the 52 countries =more than 50% dependent. DR > 80% = West African countries, Western Asian countries (oil).Also agricultural products (cotton, cocoa, coffee): some SSA countries: DR > 65%. • Transmission of world prices shocks and volatility to producing countries => volatility of macroeconomic aggregates =>low equilibria(Baffes and Gardner, 2003). • Volatility prevents diversification, risk-pooling and long term growth strategies.
Oil countries: better prospects? 2005-08 commodity boom =>impressive growth rates. But fragility (IMF, 2006):negative relationship between macroeconomic volatility and growth(Loayza et al., 2007; Ramey, 1995). Figure 9: macroeconomic volatility and economic growth Source: Loayza et al., 2007, based on the World Development Indicators, cross-country sample, 1960–2000
Negative impact of terms of trade volatility and shocks on growth: Kose and Reizman (1998): shocks, i.e. fluctuations in the prices of primary commodities => significant decrease in growth and aggregate investment in SSA. • The argument that many developed countries started growth with primary products does not hold for low-income countries, where commodities cannot be utilised as inputs in industrial processes. E.g., cocoa, coffee, oil. • Leamer et al (1999): commodity-based market structures can increase income inequality: on Latin America/ East Asia: natural-resource-intensive sectors (e.g., agriculture) absorb capital that otherwise flow to manufacturing => reduces skill accumulation =>impedes industrialisation. • Questionable argument=long-lasting low equilibria do not exist, some countries got out of them. Commodity-dependent low-income countries differ from the 1960s Asian ‘developmental states’ (and China), i.e. growth based on state-led industrial sectors, protection, limited natural resources, education, etc.
Many commodity-exporting countries = stabilisation in a low equilibrium, in a low basin of attraction, path dependence, weight of past market structures, remarkable stability of their export structure over decades. • E.g., at the beginning of the 20th century, Senegal produced 141 000 tons of groundnuts: 68% of its exports in 1929, and 80% in 1960; this commodity was still Senegal’s principal export at the end of the 20th century; • E.g., in 1990, oil represented 97% of Nigerian exports, in 2002, 100%, and 98% in 2005 (WDI 2004, 2006, 2007). • Persistence of a low industrial base: in 1990, SSA thus represented 0.79% of world industrial output, and in 2002, 0.74 %; without South Africa, in 1990, 0.24%, and in 2002, 0.25% (UNIDO, 2005). • Nissanke (2009):channels of transmission of the financial crisis to low-income countries= precipitous fall in commodity prices, escalating cost of trade finance and severe difficulties in accessing trade credit.
Cumulative causation and increasing gaps between groups of countries according to their export structure • Concept of poverty traps = a relative concept. • Even if poor countries do grow, this does not refute traps: specific market structures create traps relatively to other countries’ growth trajectories. • Hausmann and Rodrik (2006): industrialisation requires structural transformation, i.e. changing the exported products. But market failures: for a given level of development, countries with more advanced export package will grow more rapidly, while the other countries are constrained by the low productivity associated with their export package. • Dynamics of an increasing gap commodity-exporting countries/other groups: empirical observation of the secular decline in the price of commodities. • Macroeconomic volatility increases likelihood of lower equilibrium, as it entails asymmetrical processes: busts last longer than booms (Cashin et al., 2002).
Divergence confirmed in a historical perspective: Blattman et al. (2004): negative consequences of the exporting of commodities, because they have been more volatile than other products: countries with more volatile prices have grown slowly relative both to the industrialised countries and to other primary product exporters (panel of 35 countries, 1870-1939). Volatility was much more important for accumulation and growth than was secular change. • A channel = foreign capital inflows declined where commodity prices were volatile • + asymmetry industrialised/developing countries: changes in volatility had a negative influence on income growth in developing countries, but not in industrial countries:divergence confirmed by the asymmetry of the impact of ToT shocks (Hadass and Williamson, 2003 for the 1870-WWI period), confirming H Singer: the long-run impact of relative price shocks reinforced industrial comparative advantage in the ‘centre’ and favoured the sector that carried growth, while it reinforced primary product comparative advantage in the ‘periphery’, harming the sector that fostered growth. • Booth (2008): West Africa and South East Asia: widening gap in the 20th century for agricultural development, export growth and the impact of a shock such as the 1930s slump. South East Asian countries benefited from increases in productivity and public policies, vs. West African countries.
Commodity-producing countries grow because their products are the object of international demand (e.g., oil, copper): this global demand is fluctuating and unpredictable, and is boosted by technology intensity. Due to technological progress, the quantity of commodities used in a unit of GDP has steadily decreased since 1971 (World Bank, 2009a). Figure 10: technological progress has reduced the quantity of commodities used per unit of GDP Source: World Bank (2009), Global Economic Prospects
This dynamic and relative dimension of the concept of poverty trap: world distribution of output per worker =‘twin peaked’ shape: low income countries associated with a specific export structure. • Since the 1960s, only East Asian countries caught up with industrialised countries; the less developed countries are not catching up: polarisation of growth rates (Quah, 1996). • Table 2: Annual growth rates in p.c. GDP, 1870-1994 (std. deviations in parentheses) Source: Pritchett (1997). Azariadis (2006): LDCs grow a bit slower and less predictably than the world average. Outside East Asian countries, less developed countries are not catching up with OECD countries. In dynamic terms, even if these countries grow slowly (Easterly), the elevation of their income per capita is slower than other group of countries: they do not converge: clubs of countries with differing growth profiles.
The continuous decrease of the share of SSA in world trade is another signal of the divergence of a ‘club’ of countries. Figure 11: Sub-Saharan Africa's share of world exports Source: Subramanian and Matthijs (2007). Poor commodity-dependent countries caught in endogenous processes: low productivity, low value-added and the export of commoditiesreinforce each other. These factors cumulate and push economies towards lower equilibria.
Threshold effects, bifurcations and lasting impacts of shocks • Commodity-dependent countries: a 3rd feature of poverty traps= small shocks may generate large effects and make countries fall into lower equilibria: • A fortiori important and recurrent shocks, world business cycles and commodity prices cycles, which affected international trade after the 1970s. • Volatility, shocks => thresholds, lock-in effects, irreversibilities: prevents investment and its profitability, and makes fiscal and debt management difficult. • + Commodity markets are integrated => increasing returns, feedbacks. • Commodity-dependent countries = more likely to be exposed to external shocks. • Funke et al. (2008) (159 countries, 1970-2006) on persistentterms of trade shocks: SSA and the Middle- East more affectedthan Western Hemisphere and Asia-Pacific countries,due to these 2 regions lesser diversification, dependence on a few natural resources and lower manufacturing base. SSA exhibited in average more than 2 persistent terms of trade shocks.
Commodity price volatility=devastating shocks on the macroeconomic management of countries. Very difficult to maintain any fiscal balance and a credible state capacity with highly volatile and unpredictable revenues in countries where revenue from commodities may represent more than ¾ of total revenue. Figure 12: Commodity revenues to total revenue, 2008 (ratio, in percent of total revenue) Source: International Monetary Fund (2009b)
The shock of the financial crisis… Figure 13 : the fiscal vulnerability of commodity exporters Source: IMF (2009), The Implications of the Global Financial Crisis for Low-Income Countries—An Update
Hence: a large shocksuch as the 2008-09 global recession => threshold effects • The 2003-09 price shock= largest, longest since 1900, after 3 major commodity booms and slumps in the 20th century (1915–17; 1950–57; 1973–74 (World Bank, 2009a). • 2008: Oil countries: the sharpest price fluctuation within a year. • Natixis chronicle, Nov. 2009: since mid-2008, a major deterioration in global trade in value terms: unprecedented levels, more than -30% in year-on-year terms in the beginning of the spring, partly due to the collapse in commodity prices, first oil. Oil accounts = 10% of global trade, + its price divided by 5 between mid-2008 and end-2008 (though less for trade figures in volume). Sharp decline in global demand: most severe since WWII: it affected goods (capital goods, durable consumer goods, cars, etc.) financed by credit before the crisis, + drying up of the credit to the private sector.
IMF (2009a): magnitude of price changes and volatility rose to unprecedented levels for many major commodities. Table 3: Comparison of commodity price volatility (weekly; in percent) Source: IMF (2009a, April) Compared with previous cycles since 1950, prices fell much further and faster during the crisis and have recovered far more quickly. Compared with an average cycle, commodity prices dropped by 3 times the usual amount (IMF, WEO, April 2010)
The IMF commodity price index had declined by 55% between the July 2008 peak and December 2008. Figure 14: Commodity and petroleum prices Source: IMF, World Economic Outlook, April 2010
Figure 15 : the impact of the crisis on SSA: the plunge in commodity prices Sources: IMF, Regional Outlook, SSA, October 2009; IMF, Commodity Prices, and UN Comtrade. 1: Composite of cocoa, coffee, sugar, tea, and wood, weighted by SSA exports.
Source: IMF SSA Regional Outlook, April 2010: for oil producers, massive terms of-trade losses in 2009, 26.8% of GDP, coincided with a reversal in financial flows of 3.8% of GDP. For the non-oil-exporter group, terms-of-trade gains in 2008–09 offset the financing shock. Figure 16: Terms of Trade and Financial Shocks, Sub-Saharan Africa Non-Oil Exporters Figure 17: Terms of Trade and Financial Shocks, Sub-Saharan Africa Oil Exporters
Figure 18 : SSA: declining export demand Source: IMF, Regional Outlook, SSA, October 2009; IMF, World Economic Outlook. • Developingcountries with export-based market structure face a fall in demand from rich countries for their products =>end on investment projects, increased unemployment (IMF, 2009a) - investment and employment being the aggregates that have the largest impact on future incomes. • SSA: drop in external demand, falling export prices, lower capital inflows => expected growth rate of 1% for 2009, from 5.7% over 2006-08 (World Bank, 2009b). • IMF: WEO, Oct. 2009: SSA: a weaker-than-expected recovery of the global economy would slow the recovery in commodity markets => lower inflows (FDI).
Commodity prices booms, e.g., 2003-08: these shocks also have a negative impact, i.e. increased dependency vis-à-vis commodities due to higher prices. • Undiversified export structure, dependence on volatile and declining earnings=> vulnerability to external shocks = ingredients of a lack of resilience to shocks: for economies at the tipping point - in export earnings, fiscal equilibrium, institutional, individual income, etc – these ingredients precipitate a fall to a lower equilibrium. • Ex. 1979 drop in commodity prices (1986 for oil countries): despite growth rates in the 2 previous decades, it toppled commodity-exporting countries into lower equilibrium still enduring =>‘prolonged users’ of IMF financing: 3 decades later, high cost of getting out of these ‘bad’ equilibria – policies, financing–, beyond the capacities of any ‘big push’. • Commodity-dependence=>countries dependent on imports of the commodities they do not export. The volatility of the 2005-08 commodity boom hit food-importing countries, with many are at subsistence level: pushed entire groups into poverty.
The transmission of shocks and trapping processes • At the micro-level, macroeconomic volatility – shocks on commodity prices transmitted to producers’ earnings, or creating fiscal deficits reducing publicly provided social security - triggers irreversible processes for the individuals close to subsistence income. • Individuals sell the assets necessary to their future income and productivity => pushes them in a trapping, lower equilibrium: selling land, reducing spending on children’s education. • Zimmerman and Carter (2003): poverty dynamics: different households respond differently to income shocks depending on their assets. • Change in technology enhances productivity, but requires capital and access to credit, which creates thresholds and traps at the household level • The rich have access to credit, investment, higher productivity, higher returns. The poor are caught in a poverty trap compounded by indebtedness (limited access to credit markets, moneylenders’ distorted interest rates). • Rates of return positively correlated with initial wealth, which creates threshold-based multiple equilibria (Barrett and Carter, 2005).