Download
1 / 1
10 likes | 114 Vues
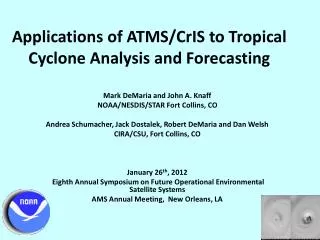
Applications of ATMS/AMSU Humidity Sounders for Hurricane Study Xiaolei Zou 1 , Qi Shi 1 , Zhengkun Qin 1 and Fuzhong Weng 2 1 Department of Earth, Ocean and Atmospheric Sciences, Florida State University, USA

E N D
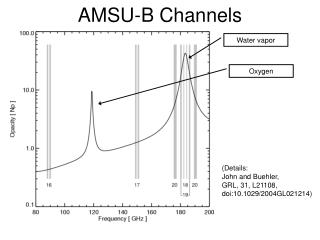
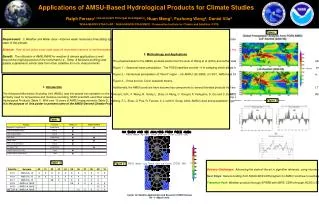
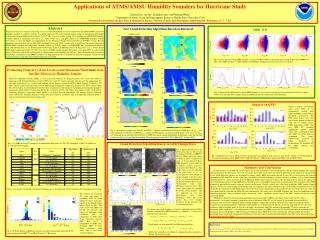
Applications of ATMS/AMSU Humidity Sounders for Hurricane Study Xiaolei Zou1, Qi Shi1, Zhengkun Qin1 and Fuzhong Weng2 1 Department of Earth, Ocean and Atmospheric Sciences, Florida State University, USA 2National Environmental Satellite, Data & Information Service, National Oceanic and Atmospheric Administration, Washington, D. C., USA 610 Abstract Tropical cyclone (TC) structures consisting of eye, eyewall and rainband are clearly resolved by the ATMS/AMSU microwave humidity sounders at a 15-km resolution. It is firstly shown that TC center location and the radius of maximum wind could be well determined from MHS window channel 2 at 157 GHz. A revised quality control (QC) algorithm for ATMS/MHS humidity sounders aiming at identifying data points for which clouds have negligible impacts on ATMS/MHS humidity sounder observations is then developed and implemented in the Hurricane Weather Research Forecast (HWRF) system. The QC algorithm is based on the ice water path (IWP) and liquid water path (LWP), which can be derived from two window channels of ATMS/AMSU humidity and temperature sounders respectively. Finally, impacts of ATMS/MHS data assimilation on hurricane track and intensity forecasts are demonstrated for Hurricane Sandy with different forecast leading times (e.g., 1-8 days) before Sandy made landfall on October 30, 2012. Over ocean, the MHS window channel derived ice water path (IWP) is used to firstly remove those data with cloud scattering effects. Improvements and algorithm are analyzed. Areas for further improvements in satellite data assimilation using HWRF are discussed. degradations by the assimilation of microwave humidity sounder data on hurricane forecasts with and without implementing the revised QC New Cloud Detection Algorithm Based on Retrieval MHS O-B Qindex GOES-13 Ch4 Fig. 5: Scatter plots of O-B of MHS channels 1-5 against O-B of GOES-12 imager channel 4 using all data during 0000 UTC May 17 to 1800 UTC May 21, 2008. Outliers indentified by GOES channel 4 is in red. Passed is in blue. Ch1 Ch2 Ch4 Ch3 Ch5 (O-B)MHS (K) IWP CLW Estimating Tropical Cyclone Location and Maximum Wind Radii from Satellite Microwave Humidity Sounder Microwave Humidity Sounder (MHS) is used to provide estimates of Tropical-cyclone (TC) center and radius of maximum wind. National Hurricane Center (NHC) best track TC center and wind radii are used for comparison. TC structures consisting of eye, eyewall and rainband can be clearly resolved by MHS window channel (Channel 2, 157 GHz). The TC center is located at the warmest MHS channel 2 brightness temperature Field of View (FOV) center within TC eyewall region. A relationship between the radius of maximum wind and the first minimum point along the brightness temperature radial profile is found. Considering the asymmetry of TCs, the radius of maximum wind is estimated by calculating brightness temperature radial profiles at six-degree interval azimuthally. The distance between hurricane center and the first minimum brightness temperature point which is continuous with its neighboring minimum points is used as estimation for radius of maximum wind. OMHS (K) OMHS (K) OMHS (K) OMHS (K) OMHS (K) Ch2 Ch3 Ch4 Ch5 Ch1 Fig. 6: Frequency distributions of O-B for MHS channels 1-5 over land (solid) and over ocean (dashed) for all observations before (red) and after (blue) implementing an additional QC step with the new cloud detection. Frequency Impacts on QPFs (a) (b) Figures 7 display the equitable threat score (ETS) of 3-h accumulative rainfall from EXP1 and EXP2 at four selected thresholds, respectively. The ETS values shows a low bias and a lower number of forecast “hits” due to random chance. EXP2 outperforms EXP1. The new MHS QC algorithm significantly improves QPFs when only conventional data and AMSU-A satellite data are assimilated. The largest improvements occurred for larger thresholds by incorporating the modified QC for MHS radiance data assimilation. (O-B)GOES Ch4 (K) (O-B)GOES Ch4 (K) (O-B)GOES Ch4 (K) (O-B)GOES Ch4 (K) (O-B)GOES Ch4 (K) Tb (K) Time (UTC) Time (UTC) Fig. 3: (a) brightness temperature (unit: K) of GOES-13 channel 4 collocated with NOAA-18 MHS data, (b) Qindex over land calculated from NOAA-18 MHS data, (c) retrieved IWP (kg/m2), (d) retrieved LWP (kg/m2) over ocean, (e) Qindex over land and ocean calculated from NOAA-18 MHS data and (f) spatial distribution of data kept (cyan) and rejected (yellow) by the new cloudy detection method. The data period is from 1552 UTC to 0026 UTC, 24 June, 2012. ETS 1 mm ETS 5 mm ETS ETS Scanline Cloud Detection Algorithm Based on GOES Image Data Fig. 1: (a) MHS observed Tb (channel2) near Hurricane Earl center at 1724 UTC September 1, 2010; (b) profiles of Tb along fixed scan angles. (a) (b) Fig. 4: Spatial distribution of all observations that (a) did not and (b) did pass GSI QC at 1800UTC May 22, 2008 with (O-B) values of MHS channel 3 indicated in color. (c) Scatter plots of O-B of MHS channel 3 (y-axis) and O-B of GOES-12 imager channel 4 (x-axis) for those data in (a). The (O-B) values in (c) are indicated in the same color as (a). (d) Scatter plots of O-B of GOES-12 imager channel 4 for those data in (b). (e) Spatial distribution of all the observations shown in (d). Observations with their differences from the mean (solid curve) greater than two standard deviations on the negative side are indicated in red and observations with their differences from the mean greater than two standard deviations on the positive side are indicated in green. Time (UTC) Time (UTC) Fig. 7::Equitable treat scores (ETS) of 3-hour accumulative precipitation (unit: mm) at 1 mm, 5 mm, 10 mm, 15 mm threshold in the entire model domain from 0000 UTC to 2400 UTC May 23, 2008 for the experiments EXP1 (red) and EXP2 (blue).. 10 mm 15 mm Summary and Conclusions A careful analysis of an MHS QC in the GSI system is first conducted. It was found that the GSI QC fails to identify some cloudy radiance data near the cloud edges. The main reasons are that model clouds and water vapor distributions do not match in its spatial extent. A new cloud detection schemes are developed to remove cloudy MHS observations missed by the GSI system based on the retrieval algorithm of LWP and IWP. On the same time, considering of infrared channels are more sensitive to clouds, a new cloud detection algorithm based on a linear regression between MHS and GOES imager channels 4 data is then developed. It was shown that adding this new cloud detection to the existing MHS QC in the GSI system successfully removes most of cloudy points. The evaluation of the ARW quantitative precipitation forecast accuracy against multi-sensor 3-hourly rainfall and 8-km high resolution GOES imager channel radiance revealed very encouraging results for the case investigated in this study. The threat scores of the EXP2 precipitation forecast for all thresholds, especially for thresholds equal to or greater than 5 mm, significantly increased after 6 hours into model forecasts when the new cloud detection algorithm for MHS data were incorporated. This study shows that MHS radiances over clear-sky conditions prior to convective initiation, when assimilated with a careful QC, had a significant positive impact for QPFs compared with the control experiment EXP1. Method to estimate TC center position and radius of maximum wind by MHS is developed. In this study, the TC center is determined as the warmest brightness temperature observation point within TC eyewall region. A relationship between radius of maximum wind and the first minimum point along the brightness temperature profile is observed. The radius of maximum wind is estimated by calculating brightness temperature radial profiles at six-degree interval. The first minimum point with lowest value and continuity with its neighbor points is chosen as the radius of maximum wind. The method of determining TC center and radius of maximum wind is applied to 12 selected hurricanes. The result shows that MHS can provide TC location and radius of maximum wind estimation that are comparable to NHC Best Track estimation. Since MHS observation onboard polar-orbiting satellite, the method mentioned above can provide estimations for hurricane center and radius of maximum wind globally, especially useful when other types of observation are not available. (c) (d) (O-B)MHS (K) (O-B)MHS (K) Table 1: List of dates, maximum wind speed and minimum sea level pressure for the hurricanes investigated in current study. The method for estimating TC center and radius of maximum wind has been applied to twelve hurricanes happened in Atlantic Basin during 2010 to 2012. The result shows that MHS can provide TC location and radius of maximum wind estimation that are comparable to NHC Best Track estimation. Because NHC Best Track is independent of MHS data, including MHS to Best Track estimation would likely lead to even more accurate estimates. (O-B)GOES (K) (O-B)GOES (K) (\e) Frequency Frequency Two linear regression equations are firstly established between GOES channel 4 and the three MHS channels (e.g., channels 1, 2 and 5) over land and ocean separately. Cloudy points are determined by the following inequalities: Reference: Zou X., Z. Qin and F. Weng, 2013: Improved quantitative precipitation forecasts by MHS radiance data assimilation with a newly added cloud detection algorithm, Mon. Wea. Rev. (accepted) Fig. 2: PDF distribution of difference between (a) radius of maximum wind and (b) TC center determined by MHS Tbs and Best Track for 12 Hurricanes. Where the thresholds are determined empirically and is specified as -4K and -2K in current study.