Grouped vs. Ungrouped Data Analysis: A Comparative Study of Continuous Data Models
30 likes | 234 Vues
This study examines the differences in data analysis outcomes between grouped and ungrouped continuous data. Through artificial examples, we analyze fit indices such as SSE, -2LL, and AICc across multiple datasets. The results reveal that while both models yield comparable insights, the grouped data tends to provide a clearer advantage in model selection, especially when analyzed through metrics like AICc. Our findings emphasize the value of understanding model structures in statistical data analysis for better predictive capabilities.

Grouped vs. Ungrouped Data Analysis: A Comparative Study of Continuous Data Models
E N D
Presentation Transcript
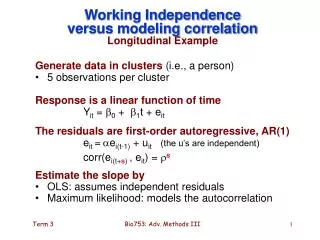
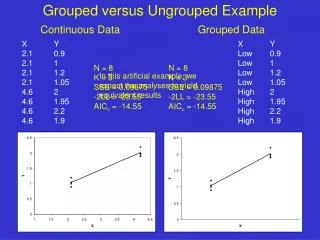
Grouped versus Ungrouped Example Continuous Data Grouped Data X Y 2.1 0.9 2.1 1 2.1 1.2 2.1 1.05 4.6 2 4.6 1.95 4.6 2.2 4.6 1.9 X Y Low 0.9 Low 1 Low 1.2 Low 1.05 High 2 High 1.95 High 2.2 High 1.9 N = 8 K = 3 SSE = 0.09875 -2LL = -23.55 AICc = -14.55 N = 8 K = 3 SSE = 0.09875 -2LL = -23.55 AICc = -14.55 In this artificial example, we expect the analyses to yield equivalent results
Grouped versus Ungrouped Example Continuous Data Grouped Data X Y 1 1.95 3.6 2 2.5 2.05 0.8 2.1 4 3.9 7.7 4.1 6.2 4.05 5.3 3.95 8.2 6 11.8 6.1 10.3 5.9 9.6 5.96 X Y Low 1.95 Low 2 Low 2.05 Low 2.1 Med 3.9 Med 4.1 Med 4.05 Med 3.95 High 6 High 6.1 High 5.9 High 5.96 N = 12 K = 3 SSE = 3.7138 -2LL = 19.98 AICc = 28.98 wi = 0.000 In this case, model selection should clearly favor the grouped data… N = 12 K = 4 SSE = 0.0587 -2LL = -29.79 AICc = -16.07 wi = 1.000 … and it does
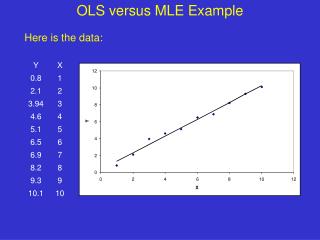
Grouped versus Ungrouped Example Continuous Data Grouped Data X Y 1 1.8 2 2.7 3 2.3 4 3.2 5 6.0 6 5.3 7 6.3 8 7.2 9 9.7 10 9.3 11 11.8 12 11.1 X Y Low 1.8 Low 2.7 Low 2.3 Low 3.2 Med 6.0 Med 5.3 Med 6.3 Med 7.2 High 9.7 High 9.3 High 11.8 High 11.1 These models appear to have similar quality of fit, with the continuous model fitting slightly better (and likely being more useful for predictive purposes). N = 12 K = 3 SSE = 6.7382 -2LL = 27.13 AICc = 36.13 wi = 0.933 N = 12 K = 4 SSE = 7.0475 -2LL = 27.67 AICc = 41.38 wi = 0.067 Model selection supports the continuous model