Download
1 / 37
370 likes | 672 Vues
Motivations to Manage Turnover 1. Economic Trends Directly related to economic conditions ∙ Unemployment rate Feb. 2010: Nation 9.7% Iowa 6.7% Turnover high when unemployment is low Turnover low during poor economic times 2. Demographic Trends Retirement patterns

E N D
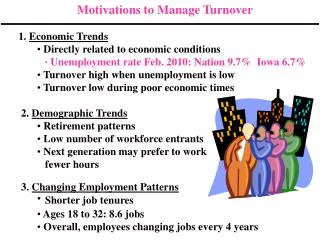
Motivations to Manage Turnover • 1. Economic Trends • Directly related to economic conditions • ∙ Unemployment rate Feb. 2010: Nation 9.7% Iowa 6.7% • Turnover high when unemployment is low • Turnover low during poor economic times • 2. Demographic Trends • Retirement patterns • Low number of workforce entrants • Next generation may prefer to work • fewer hours • 3. Changing Employment Patterns • ∙ Shorter job tenures • Ages 18 to 32: 8.6 jobs • Overall, employees changing jobs every 4 years
Motivations to Manage Turnover • 4. Normal Voluntary Turnover? • ●Fortune Magazine’s 100 Best Companies (next 2 slides) • ●Company rate/level may not be ideal anyway (AZ Council) • 1.6% month (Dec.), 2.7% (Aug) • 13 - 20% / year now normal • Some industries and low level service: • 100 - 140% normal • 5. Need to Consider Customer Satisfaction • Sears also linked T/O to customer satisfaction • ▲Stores w/high customer sat: 54% turnover • ▲Stores w/low customer satisfaction: 83% turnover • 6. Need to Manage (but not eliminate) Turnover • ▪ Who is quitting? ▪ What are the replacement costs? • 7. Need to Reduce High Replacement Costs (next slide) • ▪Direct ▪Indirect
Fortune 100 Firms with Consistently Low Voluntary Turnover Fortune
Turnover Rates: Mental Health Jobs Human Resource Assistant Secretary Maintenance Worker Driver Therapist Cook Case Manager Teachers Behavioral Health Technician Teachers Aide Supervisor Clinical Director Accountant HR Manager Controller Executive Director Annual Turnover Rates
TURNOVER COSTS Based on Entry Level Salary of $47,097 Replacement Acquisition - Direct hiring costs $1098 - Other hiring costs 693 Replacement Training - Pre-assignment 2833 - Learning curve 795 (see learning curve graph) Other costs - Unabsorbed burden 2,549 - Lost profit contribution 1,452 TOTAL $9,420 *Entry level salary of Fortune 500 employee (2010 figures)
Percent of Standard Proficiency Attained Employment Duration (Days) Hypothetical Learning Curve for New Hires
TURNOVER COST EXAMPLES BY COMPANY AND POSITION Company State govt, (LA) Machine works Insurance Software Hospitality Fast-food chain Position Protective services (police, wildlife & fisheries, guards) Salaried MachinistHourly Machinist(both journeyman) Manager Project LeaderSystems engineer Hotel front desk-Miami Hotel front desk-NY Store ManagerCounter Person Cost $25,000 $102,376$ 58,564 $ 79,672 $ 32,160$ 34,365 $ 5688 $ 11609 $ 20,765$ 1,204 Source: Bulletin to Management, 6-17-99, Kepner & Tregoe, Jan. 1999 (Saratoga Institute Turnover Costing Model), SASHA Corp 2007
Forms of Turnover • Nonvoluntary: Employer controlled (layoffs, terminations, downsizing) • Voluntary: Employee controlled (quits, retirements) • Gray Area: (spouse relocation, child/elder care problem, exit reporting problems)
Primary Reason For Leaving In Nursing Sample Reasons Unknown Personal Reasons Death Retirement Poor Health Temporary Position Completed Prescribed Service or Course Geographic Factors:Job Too Far, Leaving City Family Illness or Home Duties To Stay Home To Attend School Pregnancy Marriage Enter Military Service Unsatisfactory Work Hours Work Too Difficult; Misunderstanding of Duties General Job Dissatisfaction Present Wages Inadequate Other Employment
Analyzing Forms of Turnover Among Nurses from A Managerial Perspective: Organizational Level
Turnover Measures 1. Separation Rate # of employees who left during period = avg. # of employees during period X 100 a. Jan. 1 - 20 employees 7 quit and are replaced, 2 new hires Jan 31 - 22 employees 7/(20 + 22)/2 = 7/21 = 1/3 = .33 .33 x 100 = 33% b. Growth scenario Feb. 1 - 22 employees 16 new hires, 7 quit & are replaced Feb. 28 - 38 employees 7/(22 + 38)/2 = 7/30 = .23 or 23%
Turnover Measures (Continued) II. Instability Rate # of initial employees who leave during a period = # of initial employees X 100 a. Jan.: 7/20 = .35 or 35% b. Feb.: 7/22 = .32 or 32% III. Wastage Rate # of new employees who leave during a period = # of new members X 100 a. Between Feb. 1 & 28, 8 new hires quit: 8/16 = .50 or 50% IV. Avg. Length = Sum of length of service for each employee of Service # of members
Predictors of Voluntary Turnover • Age Turnover • (around ρ = -.14) • Length of service • ▪ side bets • ▪ health insurance less problematic • if coverage is continuous • Sex & family size • Men & women quit at similar rates • ↑ # of dependents → ↓ T/O • Pre-employment predictors: • ▪ prior turnover behavior • ▪ others in Barrick & Zimmerman
Predictors of Voluntary Turnover • Personality • ▪ Conscientiousness (ρ = -.20) • ▪ Emotional stability (ρ = -.18) • ▪Agreeableness (ρ = -.25) • ▪ Extraversion (ρ = -.04) [zero] • ▪ Openness (ρ = .10) • ▪ Self-confidence (B&Z) • ▪ Decisiveness (B&Z) • 6. Union presence • 7. Attitudes (job satisfaction, organizational • commitment; see upcoming Hom Griffeth model) • 8. Pre-employment interventions (e.g., RJPs)
Sewing Machine Operators West Point Cadets Telephone Operators Insurance Agents Bank Tellers U.S. Marines Nurses Providing Job Candidates With Accurate and Complete Information About the New Job Reduces Turnover
Predictors of Voluntary Turnover • 9. Work group size • 10. Job enrichment • 11. Task repetitiveness • 12. Considerate leadership • 13. Stress • 14. Perceived job availability • Withdrawal behaviors: Lateness (rho = .06) and absenteeism (rho = .33) • Job performance (low performers quit more than high performers but low and high performers quit more than avg. performers)
Commitment Influences: • Procedural Justice • Attraction of Internal Roles • Job Security • Job Investments • Extra Organizational Conflicts • Conditions of Job Entry • Commitment Propensity • Satisfaction Influences: • Job Complexity • Role Stress • Group Cohesion • Compensation • Leader-Member Relations • Met Expectations • Negative Affectivity Organiza-tional Commitment Job Satisfaction Shocks • Labor Market: • Unemployment • Knowledge of Other Jobs • Relocation Costs Decisions to Quit Job-Seeking Costs & Benefits: Turnover Costs & Benefits Job Search Evaluate Alternatives Resignation Hom-Griffeth Model of Turnover
POSSIBLE POSITIVE CONSEQUENCES OF TURNOVER 1. Displacement of poor performers 2. Increased satisfaction among stayers 3. Infusion of new knowledge/technology via replacements 4. Facilitate organizational change 5. Increased internal mobility opportunities 6. Decrease in other “withdrawal” behaviors 7. Opportunities for cost reduction
RECOMMENDATIONS FOR INCREASED UNDERSTANDING OF TURNOVER 1. Focus on occupational differences (more understanding of blue collar turnover needed) 2. Separate voluntary from non-voluntary turnover 3. Study turnover in the context of economic conditions and historical changes (e.g., new generations of employees, dual career families, new employment patterns of more frequent job changes).
PRACTICAL STRATEGIES FOR • MANAGING TURNOVER • Hire more carefully • Use pre-employment interventions (see example) • 3. Promote job satisfaction • 4. Promote job autonomy through job enrichment • 5. Use small work groups • 6. Reduce task repetitiveness • 7. Improve human relations skills of supervisors • 8. Reduce stress • 9. Promote organizational commitment (e.g., career counseling; • side bets) • 10. Emphasize person/job fit • 11. Address non-work sources of turnover (e.g., elder care, EAPs)
Demonstrating Cost Savings of RJP Retention Strategy Practical Application of a Control Group Evaluation
Four “Do’s and Don’ts” for Managing Turnover • Don’t fail to make the business case for managing turnover—Do provide cost/ benefit data • Don’t fail to approach turnover strategically--Do plan to attract & retain talent independent of market conditions • Don’t just throw money at the problem—Do realize that compensation is often not the most important determinant of turnover • Don’t ignore employee priorities—Do appreciate that employees first loyalty is to their own careers & that their assessment of prospects in and outside of your company will drive their turnover behavior. Source: Bulletin to Management, Sept. 26, 2002
Wright & Bonett (2007) • Job sat & Ψ well-being (PWB) as predictors of T/O • Why examine in a highly paid sample? • Authors assert that job sat is a good but insufficient predictor of T/O. Meta-analysis suggests ρ= -.19 (p. 143). Weakness due to presence of moderator variables. • What is a moderator variable?
Moderator Variables ∙When the relationship between two variables depends on a third variable (level of, presence or absence) ∙When a combination of two things becomes super- predictive or the presence of a third factor makes a difference: time spent shopping w/spouse Marital satisfaction Gender (True for women, not true for men) ∙ What moderator is proposed to affect relations between job satisfaction and turnover? How does it work?
Job Satisfaction ↓Voluntary Turnover PWB (Such that the relationship will be weak or zero when PWB is high & more strongly negative when PWB is low) ∙ Why is PWB thought to have this effect? (a) Conservation of Resources Model (b) Research finding: Job Sat Job Perf ■PWB high, stronger positive ■PWB low, weaker positivePWB
Wright & Bonett (2007) • What was the sample? • Measures? · Vol T/O 20% annually, lag (T2) 2 years. Others T1 ·Job perf measured by supervisory assessment · PWB, job sat measured by employee surveys • Review correlations in Table 1 • What role did job sat and PWB play in predicting T/O? Was the hypothesis supported? Review Table 2 and Figure 1
Wright & Bonett: Implications • Do you get more “bang for the buck” when you hire those high in PWB? • Authors point out firm is losing very best and worst performers (as also suggested by Steele et al.). How can that be addressed? • Notes potential “halo effect” limitation.
Barrick & Zimmerman • Can “people problems” like turnover be avoided by selection using dispositional factors (e.g., personality)? • How well do RJPS do, using evidence-based management? (Tries to build on its success) • What is biodata and why are some forms not used? What types of biodata are hypothesized to predict turnover? (H1-H3) • What are pre-employment factors known as “clear purpose” and “disguised purpose” predictors?
Barrick & Zimmerman Re-worded Hypotheses (so supportive correlations will be negative in direction) • H1: ↑ Prior Tenure → ↓ Turnover • H2: ↑ Were Referred → ↓ Turnover • H3: ↑ Friends & Family → ↓ Turnover • H4: ↑ Intent to Stay → ↓ Turnover • H5: ↑ Desire for Job → ↓ Turnover • H6: ↑ Self Confidence → ↓ Turnover • H7: ↑ Decisiveness → ↓ Turnover
Revised Table 2 Using Combined Samples Upshot: Biodata best predictor, even when considered last (order #2). Clear purpose measures not useful when entered last; too transparent. Disguised purpose measures helpful in both entry orders (.05 and .06).
Barrick & Zimmerman • Table 3 just an alternate statistical methodology. Table 4 indicates that use of these measures would not result in adverse impact on protected subgroups. • Practical implications: Biodata indicators examined here, along with “disguised purpose” measures of self confidence and decisiveness predict turnover as well as RJPs. (RJP: ρ= -.09; R2 =.01 vs. adj. R =.33 (Table 2) which yields adj. R2 = .11) • The value may be in combining biodata and personality with job factors (like job sat) to reduce turnover.
Hausknecht et al. (2009) • Included because it repositions the turnover topic to a discussion of employee retention • Why are “blanket” retention policies problematic? • What retention factors are hypothesized to retain high performers?
Hausknecht et al. (2009) • What retention factors are hypothesized to retain high performers? • What would low performers cite? • What retention factors were hypothesized to retain hourly employees (H2)? • What would managerial and professional employees cite?
Hausknecht et al. (2009) • What was the sample? • How was job performance measured? • Were the hypotheses supported? Findings were mixed. Not sure I care!
Hausknecht et al. (2009) • More interested in the top reasons for retention: job sat, extrinsic rewards, constituent attachments, org commitment, org prestige. • And appreciation of targeted strategies: High performers & non-hourly cited advancement opportunities & org prestige as most important for staying. Low performers & hourly cited extrinsic rewards as most important for staying.
Holtom et al. • Article rich in practical suggestions and examples of retention • Emphasis is on aligning the retention strategy with the business strategy • Reinforces Hausknecht article in asserting that the reasons people quit are distinct from the reasons people stay • What is the “overlooked” reason they believe people stay and how can it be increased?