Download
1 / 10
100 likes | 108 Vues
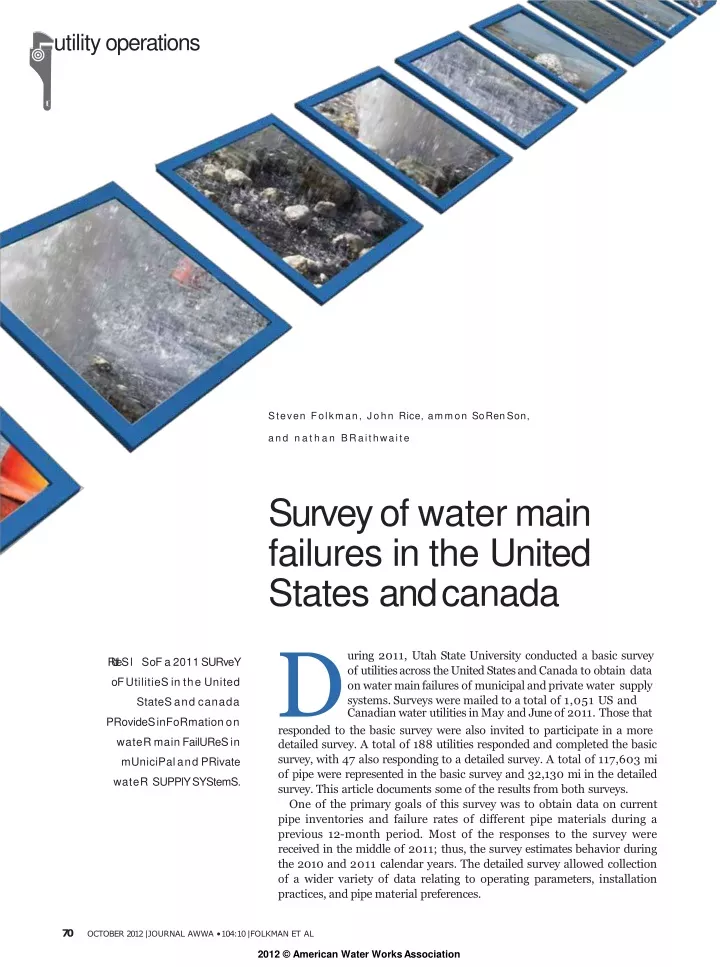
During 2011, Utah State University conducted a basic survey of utilities across the United States and Canada to obtain data on water main failures of municipal and private water supply systems. Surveys were mailed to a total of 1,051 US and Canadian water utilities in May and June of 2011.

E N D
utilityoperations StevenFolkman,JohnRice,ammonSoRenSon, and nathanBRaithwaite Survey of watermain failures in the United States andcanada DCanadianwaterutilitiesinMayandJuneof2011.Thosethat uring2011,UtahStateUniversityconductedabasicsurvey RUteS l S oF a2011SURveY oFUtilitieSintheUnited StateSandcanada PRovideSinFoRmationon wateRmainFailUReSin mUniciPalandPRivate wateR SUPPlYSYStemS. of utilities across the United States and Canada to obtaindata on water main failures of municipal and private watersupply systems. Surveys were mailed to a total of 1,051 USand respondedtothebasicsurveywerealsoinvitedtoparticipateinamore detailed survey. A total of 188 utilities responded and completed the basic survey, with 47 also responding to a detailed survey. A total of 117,603 mi of pipe were represented in the basic survey and 32,130 mi in the detailed survey.Thisarticledocumentssomeoftheresultsfrombothsurveys. One of the primary goals of this survey was to obtain data on current pipe inventories and failure rates of different pipe materials during a previous 12-month period. Most of the responses to the survey were received in the middle of 2011; thus, the survey estimates behavior during the 2010 and 2011 calendar years. The detailed survey allowed collection of a wider variety of data relating to operating parameters, installation practices, and pipe materialpreferences. 70 OCTOBER 2012 | JOURNAL AWWA •104:10 | FOLKMAN ETAL 2012 © American Water WorksAssociation
Region 8—20(4) • Region 9—12(5) • No responses were obtained from the Canadian provinces of New Brunswick, Newfoundland, Nova Scotia, Prince Edward Island, or Quebec. Figure 1 shows the miles of water main pipe that were reported in the basic and detailed surveys according toregion. water main pipe represented by those utilities. The trend line and equation are a best fit to the data with a zero intercept. The slope of this line indicates that on average there are 264 people served for each mile of water maininstalled. • SURVEYREGIONS • To show participation as a func- tion of geography, the areas covered by the basic survey were broken down into nine regions as shown in the map on page 71. The number of respondents to the basic survey are listed, followed by the number of respondents to the detailed survey in parentheses. • Region 1—19(7) • Region 2—20(4) • Region 3—26(5) • Region 4—22(6) • Region 5—18(3) • Region 6—28(11) • Region 7—23(2) SURVEY SAMPLESIZE The total length of water main pipe reported by the 188 survey par- ticipantswas117,603mi(thesurvey did not include sewer or force mains).In2007the USEnvironmen- tal Protection Agency (USEPA) reported that there are approxi- mately 880,000 mi ofdistribution MILES OF PIPE VERSUS POPULATION Figure 2 shows the relationship between the population served by the utilities participating in the basic survey and the number of milesof BC AB MB SK QC NL PEI Region9 AK ON NB WA Region1 OR NS MT ME ND VT NH MA RI CT NJ DE MN ID WI SD NY WY MI PA Region8 Region6 ILIN IA NE Region3 NV OH Region2 Region4 UT WV CO HI VA KS CA MO KY TN NC MD OK AZ NM AR SC DC GA Region7 Region5 AL MS LA TX FL This mapillustratestheregionsas theyweredefinedtoreportthebasic anddetailedsurveyresults. FOLKMAN ET AL | 104:10 • JOURNAL AWWA | OCTOBER2012 71 2012 © American Water WorksAssociation
survey would then represent approx- imately 10% of the installed water main pipe in the United States.Thus quantified the size of a utility based on the number of miles of water main pipe installed. Four categories were established according to miles of pipe: small (up to 500 mi), medium (500–1,000 mi), large (1,000–3,000 mi), and very large (more than 3,000 mi). Each survey participant was allocated to one of the categories. Figure 3 shows the distribution of total miles according to thesecategories. pipe in the United States (USEPA, 2007). The following year, asecond report (Royer, 2008) estimatedthe aprimarygoalofthissurveywastoobtaindata oncurrentpipeinventoriesandfailureratesofdifferent pipe materials during a previous 12-monthperiod. survey sample size is significant and should provide reliable results. The Canadian provinces comprised 8,423 mi of pipe in this survey, or 7.4% of thetotal. amount of installed water main pipe in the United States to be more than 1 million mi. The currentpopulation of the United States is 312 million (US Census, 2011). Using the esti- mate from the previous section of 264 people served per mile of water main, the length of water mains can be estimated to be 1.18 million mi ([312 million people]/[264 people/ mile]). With the use of this last esti- mate, the total length of pipe inthe PIPEMATERIALS Many pipe products have evolved over time, and most of these could be broken down into subcategories on the basis of processing and sur- face treatments. These changes, along with new installation tech- niques, should affect the life expec- tancy of the pipe. The basic survey was intended to be relatively simple to complete in order to encourage wide participation. Most utilities have limited records as to which spe- cific pipe materials were installed decades ago. Therefore, subcatego- ries of material types were not tracked in the survey. The results reported in this article represent generic pipe material performance, but may not represent a specific product on the markettoday. The distribution of pipematerials based on miles of pipe is shown in Figure 4. Pipe material distribution as a percentage of the total length for both the basic and detailed sur- veys is shown in Figure 5. The detailed survey had a smaller num- ber of respondents but still gave a similar material distribution. The “other” category in Figures 4 and 5 includes materials such as high- density polyethylene, galvanized steel, and copper. Eighty percent of the installed water mains are a combination of cast-iron at 28%, ductile-iron at 28%, and polyvinyl chloride (PVC) pipe at 23%. The amount of concrete pressure pipe (CPP), steel, and asbestos–cement (AC) material types were also reported. The length of high-den- sity polyethylene pipe reportedrep- PARTICIPANTS CLASSIFIED IN FOURCATEGORIES The average utility surveyed had 626 mi of water main, with the largest having 4,468 mi and the smallest having 2 mi.This survey Totalmilesofpipebyregionrespondingtothe basic anddetailed surveys FIGURE1 Basicsurvey 25,000 20,000 Pipe—mi 15,000 10,000 5,000 0 5 Region 1 2 3 4 6 7 8 9 Detailedsurvey 8,000 6,000 Pipe—mi 4,000 2,000 0 5 Region 1 2 3 4 6 7 8 9 72 OCTOBER 2012 | JOURNAL AWWA •104:10 | FOLKMAN ETAL 2012 © American Water WorksAssociation
point in their systems during a typical day. The survey indicated that approximately 83% of respondents are able to limit pressure fluctuations to less than 20 psi, 11% hadpressure fluctuations between 20 and 40psi, Respondents were also asked to break down the fraction of total installed pipe length by five pipe-diam- eter categories. Figure 8, which shows the percentage of water mains that fit into each size range, indicatesthat resented only 0.14% of the total and thus was not tracked as a sepa- rategroup. Figure 6 shows the regional distri- bution of pipe material type as a percentage of the total length of pip- ing in that region. Significant differ- ences can be seen in the type of pipe material used in the regions. Cast and ductile iron represent approxi- mately 90%of the pipe in regions 6 and 8. PVC has a dominant role in region9andisasignificantplayerin regions 2–5, and7. Pipe age and diameter. The detailed survey asked respondents to provide the age distribution of installed pipe. Four age groups were provided: 0–10 years, 10–20 years, 20–50 years, and more than 50 years. Fig- ure 7, which lists the percentage of water main length that fits in each age category, indicates that approxi- mately 43% of installed pipes are in the 20–50-year age category and 22% are more than 50 years old. thetotalmilesofpipecoveredbythissurveyisalmost 10%ofthatinuseintheUnitedStates. and 6% have pressure fluctuations in excess of 40psi. approximately 66% of the installed pipe is 8 in. or less indiameter. Delivery pressure. On the basis of results received in the detailed survey, the average delivery pressure was determined to be 77 psi. The range of values reported for average delivery pressure was 45–150 psi. Respon- dents were asked to select one of three ranges provided in the detailed survey to indicate how much the water pressure fluctuates at anygiven PIPEFAILURE Most common failure mode, mate- rial, and age. The detailed survey asked the respondents to identify the most common water main failure mode by selecting from one of the following categories: circumferential crack, corrosion (pits or holes),lon- gitudinal crack, leakage atjoints, FIGURE2 Populationservedrelativetototalpipelinemilesfromthebasicsurvey 1,400,000 y = 263.78x R2 = 0.8014 1,200,000 1,000,000 800,000 600,000 400,000 Population 200,000 0 0 1,000 2,000 3,000 4,000 5,000 Pipe—mi FOLKMAN ET AL | 104:10 • JOURNAL AWWA | OCTOBER2012 73 2012 © American Water WorksAssociation
fatigue,orother.Figure9showsthat circumferential cracks are the most common mode of failure, followed by corrosion. The detailed survey also asked respondents to identify which pipe material failed most often. Figure 10 shows that slightly more than 55% of respondents iden- tified cast iron as the pipe material that failed most often (likely because it is one of the two most commonly used pipe materials and on average is the oldest pipe material in use), followed by AC at 17%. Respon- dents also reported that the typical age of a failing water main was 47 years, with a range of values from 20–86 years. The survey also asked what the respondents believed the expected life should be for newly installed pipe. Respondentsexpected new pipe to have an average life span of 79 years, with responses ranging from 30 to 200years. Computing failure rates. The basic survey asked respondents to consider a water main failure as one in which leakage was detected and repairs were made. However, they were asked not to report failures caused by joint leakage, construction dam- age, or tapping of service lines. The goal of the survey was only to exam- ine the performance of properly installedpipe. Utilities reported the number of failures over a recent 12-month period according to pipe material and the installed length of pipe mate- rial. The failure rate was computed by dividing the total number of fail- ures from all utilities for a particular pipe material by the total length of that pipe material. For example, the survey reported a total of 12,963 failures of water mains during a recent 12-month period for all pipe materials. The total installed water main length from the survey was 117, 603 miles (or 1,176.03 hun- dreds of miles). Thusthe overall fail- ure rate is 12,963/1,176.03 = 11.0 failures/(100 miles)/year. Figure 11 shows the failure rate at each utility for all pipe materials and indicates that utilities can experiencewidely TABLE1 Summaryoffailuredataovera12-monthperiod FIGURE3 Totalmilesofpipeineachsizegroup 35,000 30,000 25,000 Total Length ofPipe—mi 20,000 15,000 10,000 5,000 0 0–500 500–1,500 1,500–3,000 Utility Size Group (in miles ofpipe) 3,000–5,000 Totallengthofpipeclassifiedaccordingtomaterial type from the basicsurvey FIGURE4 40,000 35,000 30,000 25,000 20,000 Other includes HDPE,galvanized steel, andcopper Pipe—mi 15,000 10,000 5,000 0 CI DI PVCCPPSteelACOther AC—asbestos–cement, CI—cast iron, CPP—concrete pressure pipe, DI—ductile iron, HDPE—high-density polyethylene, PVC—polyvinylchloride 74 OCTOBER 2012 | JOURNAL AWWA •104:10 | FOLKMAN ETAL 2012 © American Water WorksAssociation
the maximum life out of a water main. The survey asked whether the respondents’ utilities used contractor experience as a weighting factor dur- ing the selection process. Sixty-six percent of respondents do consider contractor experience. Many of those respondents who do not con- sider contractor experience reported that state or local laws prevented them from doingso. and AC pipes, PVC wasshownto have the lowest overallfailurerate. Plans for replacing watermains.The detailed surveyaskedwhether respondents had a planforregular replacement of water mainsthatare nearing their end of useful life. More than 77% reported they dohavea replacement plan in place.Thesurvey also asked what percentageofwater mains are beyond their useful lifebut different failure rates for the same pipe material. This finding should not be surprising. Several significant variables affect pipe performance, including age, soil types (corrosive or noncorrosive), corrosionpreven- tion techniques, installation prac- tices, and climate. Thus a utility may have a significantly different failure rate from those reported here. To compute an average failure rate for a given pipe material, a large num- ber of respondents areneeded. Failure rates for each pipe material. The basic survey measured pipe fail- ures over a recent 12-month period, broken down by material type. Table 1 lists the total length of pipe by material type, the number of fail- ures over a recent 12-month period, and the failure rate for each pipe material. Figure 12 shows the failure rates as a function of material type, and Figure 13 classifies the failure rates by material type and by US and Canadian respondents. When the failure rates per 100 mi of pipe per year were compared for cast-iron, ductile-iron, PVC, concrete,steel, itisimperativethatutilitiesmakewisechoiceswhen repairing and replacing pipe, andbenchmarking can provide guidance in making thosedecisions. Allowed pipe materials. Results from the survey indicated that 87.2% of utilities would allow installationofductileiron,59.6%of PVC, 38.3% of concrete pressure, and 36.2% of steel pipe. Typical comments regarding pipe exclusion included “corrosion issues for duc- tile iron and steel” and“strength, have yet to be repaired/replaced because of a lack of funds. Respon- dents reported that from zero to 75% of their pipe was beyond its useful life. The average of all respondents showed that 8.4% of the pipe is beyond its usefullife. Contractor experience. Proper installation is important togetting FIGURE5 Percentageoftotallengthofpipeclassifiedbymaterialtypefromthesurveys Basic Detailed 35 30 29 28 28 27 25 25 23 TotalLength—% 20 15 12 11 10 5 4 3 3 3 2 2 0 Other CI Steel PVC CPP DI AC AC—asbestos–cement, CI—cast iron, CPP—concrete pressure pipe, DI—ductile iron, PVC—polyvinylchloride FOLKMAN ET AL | 104:10 • JOURNAL AWWA | OCTOBER2012 75 2012 © American Water WorksAssociation
FIGURE6 RegionalpercentageoflengthofpipeclassifiedbymaterialtypefromthebasicsurveyFIGURE6 Regionalpercentageoflengthofpipeclassifiedbymaterialtypefromthebasicsurvey PVC CI DI Other AC Steel CPP 9 8 7 6 Region 5 4 3 2 1 0 10 20 30 40 50 60 InstalledLength—% AC—asbestos–cement, CI—cast iron, CPP—concrete pressure pipe, DI–ductile iron, PVC—polyvinylchloride 76 OCTOBER 2012 | JOURNAL AWWA •104:10 | FOLKMAN ETAL 2012 © American Water WorksAssociation
tapping difficulties, and bedding concerns for PVC.” Comments regarding CPP included “difficult to install, tap, and repair” and “has corrosionissues.” Leak-detection methods. The detailed survey asked respondents whether regular leak-detection methods were used at their utility, and 57% indicated that they were. The methods of leak detection used included acoustic leak detectors, visual inspection of lines, digital correlation sensors, and eddy cur- rentdetectors. Corrosive soils and corrosion pre- vention treatments. The detailed sur- vey asked respondents whether there are one or more regions in their service area with soils that are corrosive. A total of 75% of the respondents reported that they have at least one area with corrosive soils. Thus, corrosion is a signifi- cant problem for most of the re- spondents. The survey also asked what kind of corrosion treatments they are currently using. Typical corrosion prevention treatments for DI pipe included polywrap and the installation of magnesium anodes. Covered bedding improvements, type 50 concrete, coatings, and the use of anodes were common treat- ments for CPP. Steel pipe corrosion treatments listed impressed current, anodes, and protectivecoatings. Effect of ambient temperature on fail- ures. The detailed survey asked whether the utility observed an increase in water main failures with extreme ambient temperatures, either warm or cold. The results indicated that 72% of the respondents did note an increase in pipe failures with extreme cold ambient temperatures and only 13% reported acorrelation with warm temperatures. Clearly this result would be dependent on the cli- mate at eachutility. Percentofpipelengthclassifiedaccording toagefromthedetailedsurvey FIGURE7 50 43.3 40 TotalLength—% 30 22.2 18.4 20 14.9 10 1.3 0 0–10 10–20 20–50 >50 Unknown PipeAge—years Percentageofpipelengthclassifiedaccordingtopipediameter from the detailedsurvey FIGURE8 70 60 65.9 50 TotalLength—% 40 30 20 18.4 10.1 10 0 3.4 2.2 S8 10–14 16–24 30–36 S36 PipeDiameter—in. Percentofrespondentsselectingamostcommon failuremode FIGURE9 60 50 50 Respondents—% 40 28.3 30 20 13.0 10 4.3 2.2 2.2 0 CONCLUSION To capture statistically signifi- cant water main break data that can provide an accurate portrayal of current pipe behavior andwater Corrosion Fatigue Other Longitudinal Crack Leak Circumferential Crack FOLKMAN ET AL | 104:10 • JOURNAL AWWA | OCTOBER2012 77 2012 © American Water WorksAssociation
The primary water main pipe materials in use today are cast iron (28% of the installed base), ductile iron (28%), and PVC (23%). The survey results indicate that the type of pipe material installed varies sig- nificantly across the regions; approx- imately 90% of the pipe in the northeastern United States is either ductile or cast iron, whereas PVC is the dominant pipe inCanada. • Water main pipecharacteristics uncovered by the survey indicate that more than 22% of currently installed pipe is more than 50 years old and that about 66% of water mains are 8 in. or less in diameter. The average age of a failing water main was only 47 years, with 8.4% of pipes classified as being beyond their useful life. These results are in sharp contrast to respondents’ beliefs that new pipe should last 79 years onaverage. • The average delivery pressureis 77 psi and 83% of utilities keep water pressure fluctuations at less than 20psi. • The survey also found various limitations placed by utilities on pipe materials. The percentage of utilities allowing installation of specific pipe materials is as follows: ductile-iron pipe—87%, PVC pipe—60%,con- crete pressure pipe—38%, andsteel pipe—36%. • Utilities exhibit alarge variation in water main failurerates. • Approximately 75%of utilities have at least one region in their ser- vice area with corrosivesoils. • This survey found that on the basis of the number of failures per 100 mi of pipe per year, PVC pipe currently has the lowest overall failurerate. • Information from this survey is intended to assist utilities in seeing how they compare with national norms. The amount of pipe ap- proaching the end of its life is grow- ing. It is imperative that utilities make wise choices when repairing and replacing pipe, and benchmark- ing can provide guidance in making thosedecisions. • individual utilities as possible internalbenchmarks. • There are approximately 264 people who are served per mile of water main pipe, which is an average number representing both rural and urbanpopulations. utility practices requires a large number of participants. The total miles of pipe covered by this sur- vey is almost 10% of that in use in the United States. From these data many observations can be made at a national level and appliedto FIGURE 10 Percent of respondents selecting a mostcommon failurematerial 60 55.3 50 40 Respondents—% 30 20 17.0 10 6.4 6.4 4.3 4.3 2.1 0 CI DI PVC CPP Steel AC Other AC—asbestos–cement, CI—cast iron, CPP—concrete pressure pipe, DI–ductile iron, PVC—polyvinylchloride Totalfailureratesateachutilityrelativetomilesofpipeforallpipe materials FIGURE11 70 60 (Number of Failures)/(100mi)/year 50 40 30 Average 20 10 0 1,000 2,000 3,000 4,000 5,000 0 Pipe—mi 78 OCTOBER 2012 | JOURNAL AWWA •104:10 | FOLKMAN ETAL 2012 © American Water WorksAssociation
ACKNOWLEDGMENT This work was completed with support from Uni-Bell PVC Pipe Association and the Water Finance ResearchFoundation. FIGURE 12Failureratesofeachpipematerialper100mioveraone-yearperiod 30 ABOUT THEAUTHORS 24.4 25 Steven Folkman is an associate professor at Utah State University, 4130 Old Main Hill, Logan, UT 84332-4130; steven.folkman@ 21.0 Failures/(100mi)/year 20 15 13.5 10 7.1 5.4 4.9 5 2.6 usu.edu. A member of AWWA, Folkman has oversight of Utah State’s Buried Structures Laboratory, is co-author of Buried Pipe Design, and has been involved with analysis and testing of buried structures for more than 20 years. His work has been published previously in Journal of Civil Engineering and Architecture and Transportation Research Record. He received his BS, MS, and PhD degrees from Utah State University. John Rice is an assistant professor and Ammon Sorensen and Nathan Braithwaite are research assistants, all at Utah StateUniversity. 0 CI DI PVC CPP SteelAC Other AC—asbestos–cement, CI—cast iron, CPP—concrete pressure pipe, DI–ductile iron, PVC—polyvinylchloride FIGURE 13FailureratesreportedinthissurveybyUSandCanadianrespondents US Canada REFERENCES Royer, M.D., 2008. Condition Assessment of Drinking Water Transmission and Distri- bution Systems. Presented at EPA Sci- ence Forum 2008, Washington, D.C., May 20–22, 2008. www.epa.gov/awi/ pdf/600f09030.pdf (accessed Aug. 31, 2012). US Census, 2011. www.census.gov/ (accessed Oct. 5,2011). USEPA (US Environmental Protection Agency), 2007. Distribution System Inventory, Integrity and Water Quality. www.epa.gov/ogwdw/disinfection/tcr/ pdfs/issuepaper_tcr_ds-inventory.pdf (accessed Aug. 31,2012). 40 35.0 35 30 Failures/(100mi)/year 23.9 25 21.3 20 15.2 13.8 15 13.4 10 7.07.5 6.2 4.3 3.9 5 2.9 0.9 0.7 0 CI DI PVC CPP Steel AC Other http://dx.doi.org/10.5942/jawwa.2012.104.0135 AC—asbestos–cement, CI—cast iron, CPP—concrete pressure pipe, DI–ductile iron, PVC—polyvinylchloride JournalAWWA welcomes comments andfeedback atjournal@awwa.org. FOLKMAN ET AL | 104:10 • JOURNAL AWWA | OCTOBER2012 79 2012 © American Water WorksAssociation