Download
1 / 63
630 likes | 744 Vues
Understand the intricate processes of cardiac muscle contraction in this detailed lecture by Dr. Gollwitzer. Learn about contractile and conducting cell functions, action potentials, and the cardiac conducting system. Figure illustrations and in-depth explanations provided.

E N D
Chapter 20: The Heart BIO 211 Lecture Instructor: Dr. Gollwitzer
Today in class we will discuss: • The heart and the heartbeat • The 2 types of cardiocytes (heart muscle cells) involved • The structure and characteristics of contractile cells • Structures of cardiac muscle tissue • The events of an action potential (AP) in cardiac muscle • AP of cardiac muscle compared to skeletal muscle • The role of calcium (Ca2+) ions in the contractile process • The components and functions of the conducting system of the heart
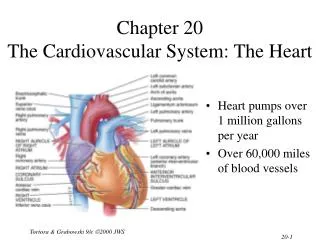
Heart • Main function is to: • Receive blood from veins at low pressure, • Pump it through arteries at pressure high enough to get it through blood vessels and • Back to heart again • Heartbeat = single contraction of the heart • Entire heart contracts in specific sequence so that blood flows in right direction at right time • First the atria • Then the ventricles
Heart and the Heartbeat • Contraction of atria first and then ventricles occurs because contractions of individual cardiac muscle cells that make up heart chambers occur in a specific sequence • Involves 2 types of cardiac muscle cells • Contractile cells • Produce contractions that move blood through heart • Conducting system cells • Control and coordinate contractile cells • Control and coordinate heartbeat
Contractile Cells • Cardiocytes • 99% of muscle cells in heart • Make up most of atria and ventricle walls (myocardium) • Form branched network
Cardiac Muscle Tissue • Myofibrils striations • Thin filaments (actin) • Thick filaments (myosin) • Intercalated discs • Region in muscle tissue where membranes of adjacent cardiac muscle cells are interconnected • Transfer force of contraction from cell to cell • Have 2 types of cell junctions • Gap junctions • Allow ions and small molecules to move easily between cells • Form direct electrical connection between cardiocytes • Desmosomes • Interlock adjacent cardiac cells together to prevent cells from separating during contraction
Review: Action Potential in a Neuron Table 12-3 8th Edition
Contraction of Cardiac Muscle • Action potential (AP) • = Electrical impulse conducted by muscle fiber • Leads to appearance of Ca2+ among myofibrils • Ca2+ binds to troponin (muscle protein) on actin (thin filaments) • Initiates contraction
Origin of AP in Cardiac Muscle • Resting membrane potential of ventricular contractile cell = -90 mV • Stimulus = excitation of cardiac muscle cell • Membrane of muscle cell brought to threshold (-75 mV) • Usually reached next to intercalated disc • AP begins
Action Potential in Cardiac Muscle Fig. 20-15a
Action Potential in Cardiac Muscle • Proceeds in 3 steps • Depolarization • Voltage-regulated fast Na+ channels open, Na+ rushes into cell • Na+ channels close when transmembrane potential reaches +30 mV • Plateau • As Na+ channels close, voltage-regulated slow Ca2+ channels open, Ca2+ enters cell • Provides 20% of Ca2+ required for contraction; 80% from SR • Transmembrane potential remains at 0 mV for extended period of time (during Ca2+ entry) • Ends with closure of slow Ca2+ channels • Repolarization • As Ca2+ channels close, slow K+ channels open • K+ leaves cells • Restores resting potential to -90mV
Refractory Period • = Time after action potential begins when muscle will not respond normally to a second stimulus • Absolute refractory period • Time after AP when membrane absolutely cannot respond because Na+ channels opened/closed • Long in length • Lasts thru plateau and initial part of repolarization (approx. 200 msec) • Relative refractory period • = time following absolute refractory period when muscle can respond to stronger-than-normal stimulus • Shorter than absolute refractory period • Lasts thru repolarization (approx. 50 msec)
Action Potentials in Cardiac and Skeletal Muscle Figure 20–15a, b
Conducting System • Cardiac muscle contracts on its own • Autorhythmicity or automaticity • vs. neural/hormonal stimulation for skeletal muscle • System of specialized cardiac muscle cells • Initiate and distribute electrical impulses that stimulate contractions
Conducting System • 3 Components to cardiac conduction (nodal) system • Sinoatrial (SA) node • Atrioventricular (AV) node • Conducting cells • From SA node to • Atrial myocardium • AV node along internodal pathways • From AV node to ventricular myocardium
Figure 20-11a The Conducting System of the Heart Sinoatrial (SA) node Internodal pathways Atrioventricular (AV) node AV bundle Bundle branches Purkinje fibers Components of the conducting system
Sinoatrial (SA) Node • In posterior wall of R atrium near entrance to superior vena cava • Contains cardiac pacemaker cells • Originate/generate action potential • Reach threshold first • Establish heart rate • Abnormal function • Tachycardia = heart rate faster than normal (>100 bpm) • Bradycardia = heart rate slower than normal (<50 bpm) • Connected to AV node by internodal pathways in atrial walls
Atrioventricular Node • Larger than SA node • In floor of R atrium near opening of coronary sinus
Conducting Cells • Smaller than contractile cells • Connect SA and AV nodes • Distribute contractile stimulus throughout myocardium • Atrial conducting cells • In internodal pathways in atrial walls • Distribute contractile stimulus to atrial muscle cells as impulse travels from SA node to AV node • Ventricular conducting cells • In IV septum • In AV bundle (bundle of His), L & R bundle branches and Purkinje fibers that distribute stimulus to ventricular myocardium
Path of an Impulse from Initiation at SA Node to AV node • As AP passes from SA to AV node, conducting cells pass stimulus to contractile cells of both atria • AP then spreads across entire atria via cell-to-cell contact • Rate of propagation slows as impulse leaves internodal pathway • Nodal cells smaller in diameter than conducting cells • Connections between nodal cells less efficient • Results in delay at AV node • Important because atria must contract before ventricles
AV Bundle, Bundle Branches, and Purkinje Fibers • Connection between AV node and AV bundle (aka Bundle of His) is only electrical connection between atria and ventricles • Fibrous skeleton around valves “insulates” other AV connections • When impulse enters AV bundle, it: • Travels to the interventricular septum • Enters the R and L bundle branches • Both bundle branches extend toward the apex of the heart and fan out deep into the endocardial surface • As branches diverge, they conduct impulse to: • Purkinje fibers • Papillary muscles of right ventricle • Purkinje fibers radiate from apex to base • Contraction of ventricles occurs as a wave that begins at the apex and spreads toward the base
Summary of Cardiac Conduction • Before each heart beat (contraction) • Action potential initiated spontaneously at SA node • Wave of depolarization radiates from SA node • Spreads through contractile cells of atrial myocardium • To AV node • Travels down IV septum to apex • Turns and spreads through contractile cells of ventricular myocardium to the base
Today in class we will discuss: • The electrocardiogram • Important features of an electrocardiogram recording • The electrical events associated with an electrocardiogram • The cardiac cycle • The events that occur during the cardiac cycle • How different heart sounds are related to specific events in the cardiac cycle • Cardiac arrhythmias • Cardiac output and describe factors that influence it • Age related changes in the heart
Figure 20-13a An Electrocardiogram Electrode placement for recording a standard ECG.
Electrocardiogram (ECG, EKG) • = Record of electrical events in heart • Associated with conduction/propagation of heart beat • Strong enough to be detected on body surface • Can monitor electrical activity of heart by comparing info from electrodes at specific body locations • ECGs reveal abnormal patterns of impulse conduction • When portion of heart is damaged, those cells no longer conduct AP
Figure 20-13b An Electrocardiogram 800 msec R R P wave (atria depolarize) S–T segment T wave (ventricles repolarize) P–R segment Millivolts Q S S–T interval P–R interval QRS interval (ventricles depolarize) Q–T interval
Electrocardiogram • Important features of an ECG • P wave = atrial depolarization • Small wave • Atria start contracting about 100 msec after start of Pwave • QRS complex = ventricular depolarization and atrial repolarization • Strong signal because ventricular muscle more massive than atrial muscle • Complex because also includes atrial repolarization • Ventricles start contracting shortly after peak of R wave • T wave = ventricular repolarization • Small, like P wave
ECG Analysis • Measure: • Size of voltage changes: usually focused on amount of depolarization occurring during P wave and QRS complex • Small P wave = mass of heart muscle decreased • Large QRS = heart has become enlarged • Small T wave = affected by anything that slows ventricular repolarization • e.g., starvation, low cardiac energy reserves, coronary ischemia, abnormal ion concentration
ECG Analysis • Measure: • Duration and temporal relationships of various components • Reported as intervals • P-R interval • = From start of P wave to start of QRS complex • Extension may indicate damage to atrial conducting pathways or AV node • Q-T interval • = From end of P-R interval to end of T wave • Extension may indicate conduction problems, coronary ischemia, myocardial damage, congenital heart defect
Cardiac Arrhythmias • = Abnormal patterns of electrical activity • Normal if transient • Clinical problems may develop and reduce pumping efficiency of heart • May indicate: • Damage to myocardium • Injury to pacemaker or conducting pathways • Exposure to drugs • Variation in electrolyte concentration • Asystole = flatline
Cardiac Cycle Figure 20–11 9th Edition
Cardiac Cycle • = Period between start of one heartbeat and beginning of next • Includes electrical events and associated blood flow • Lasts approx. 0.8 sec in resting adult (72/min) • Involves alternating periods of contraction and relaxation of atria and ventricles
Cardiac Cycle • Systole = contraction (squeezing) of chambers • Pressure in chambers rises (systolic pressure) • In RV=30 mm Hg (only pumps blood through pulmonary circuit) • In LV=120 mm Hg (pumps blood through systemic circuit) • Pushes blood into adjacent chamber or arterial trunks • Diastole = relaxation (dilation) of chambers • Pressure in chambers drops • Chambers fill with blood and prepare for next cardiac cycle
Cardiac Cycle • Blood flows from one chamber to another only if pressure in first exceeds that of second • Controlled by timing of contractions • Directed by 1-way valves • Phases of cardiac cycle • Atrial systole • Atrial diastole • Ventricular systole • Ventricular diastole
Figure 20-16a Phases of the Cardiac Cycle Atrial systole begins: Atrial contraction forces a small amount of additional blood into relaxed ventricles. Start 0 msec 800 msec 100 msec Cardiac cycle
Figure 20-16b Phases of the Cardiac Cycle Atrial systole ends, atrial diastole begins 100 msec Cardiac cycle
Figure 20-16c Phases of the Cardiac Cycle Cardiac cycle Ventricular systole— first phase: Ventricular contraction pushes AV valves closed but does not create enough pressure to open semilunar valves.
Figure 20-16d Phases of the Cardiac Cycle Cardiac cycle 370 msec Ventricular systole— second phase: As ventricular pressure rises and exceeds pressure in the arteries, the semilunar valves open and blood is ejected.
Figure 20-16e Phases of the Cardiac Cycle Cardiac cycle 370 msec Ventricular diastole—early: As ventricles relax, pressure in ventricles drops; blood flows back against cusps of semilunar valves and forces them closed. Blood flows into the relaxed atria.
Figure 20-16f Phases of the Cardiac Cycle 800 msec Cardiac cycle Ventricular diastole—late: All chambers are relaxed. Ventricles fill passively.
Cardiac Cycle • People can usually survive with severe atrial damage • Because atrial systole makes relatively minor contribution to ventricular volume • Damage to one or both ventricles leads to heart failure • Lack of adequate blood flow to peripheral tissues/organs • Although both atria and ventricles undergo systole and diastole, terms usually refer to ventricular contraction and relaxation
Heart Sounds • Closing of valves and rushing of blood through heart characteristic heart sounds heard during auscultation with stethoscope • AV valves close = “lubb” (S1) • Semilunar valves close = “dubb” (S2) • S3 and S4 are sounds of blood flowing through heart
Figure 20-18 Heart Sounds Sounds heard Aortic valve Valve location Semilunar valves open Valve location Semilunar valves close Pulmonary valve Sounds heard Aorta Pressure (mm Hg) Left ventricle Left atrium AV valves open AV valves close Left AV valve Sounds heard S1 S2 Valve location S4 S4 S3 Heart sounds Right AV valve Valve location Sounds heard “Lubb” “Dubb” The relationship between heart sounds and key events in the cardiac cycle Placements of a stethoscope for listening to the different sounds produced by individual valves