Download
1 / 18
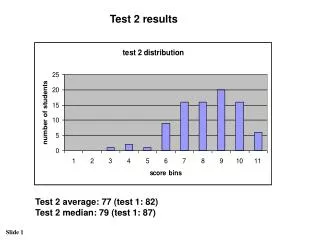
180 likes | 356 Vues
Ultimate-2 sensors preliminary summary of LBL probe test results. Introduction Wafer maps: 1 STD epi, full thickness 5 high-res 2 DRIE Summary Distribution of Noise/FPN Additional slides. Introduction.

E N D
Ultimate-2 sensorspreliminary summary of LBL probe test results • Introduction • Wafer maps: • 1 STD epi, full thickness • 5 high-res • 2 DRIE • Summary • Distribution of Noise/FPN • Additional slides
Introduction • LBL probe testing procedure is currently used for testing and selecting sensors for ladder construction for the prototype detector • The yield that we have observed so far is satisfactory • IPHC requested several sensors for additional analysis of sensor performance • 8 sensors were available at the time of the request • Mathieu discovered several issues with the sensors he tested • What is the impact of the identified problems on our testing procedure and sensor selection?
Yield and wafer map – U2 thick, std epi Vref2 high Vref2 low • Wafer 501: • Tested: 29 • good: 9 31% • bad: 15 52% • (?): 5 17% Failed 160 MHz • Wire-bonded (power consumption – NA) • A02 – ok at 3.3 V but cross-talk • B02 – ok • C06 – ok High VCLP High power
Yield and wafer maps – wafer 201,202 Vref2 high Vref2 low Initial classification : colors Ladder selection criteria : numbers (grades) 1-3 • Wafer 201: • grade 1 11 • grade 2 19 • grade 3 9 • dummies 9 • Wafer 202: • grade 1 19 • grade 2 18 • grade 3 0 • dummies 7 • other 4 grade 2 <1% bad pixels High VCLP High power
Yield and wafer maps – wafer 203,204 Vref2 high Vref2 low • Wafer 203: • grade 1 6 • grade 2 6 • grade 3 1 • dummies 2 • other 1 • Wafer 204: • grade 1 18 • grade 2 7 • grade 3 3 • dummies 14 • other 1 grade 2 <1% bad pixels High VCLP High power
Yield and wafer maps – wafer 205 Vref2 high Vref2 low • Wafer 205: • grade 1 21 • grade 2 11 • grade 3 3 • dummies 11 • other 2 grade 2 <1% bad pixels High VCLP High power
Yield and wafer maps – 2 DRIE wafers Vref2 high Vref2 low • Wafer 303: • grade 1 11 • grade 2 3 • grade 3 8 • dummies 12 • “skipped” 12 • Wafer 304: • grade 1 19 • grade 2 12 • grade 3 6 • dummies 11 grade 2 <0.1% bad pixels grade 3 0.1-1.7 % bad pixels Failed 160 MHz High VCLP High power
Summary • Tests at IPHC indicated holes in the currently used sensor selection procedure • All identified issues had been measured in probe tests but were not part of the selection criteria • It is necessary (and becoming urgent) to develop more advanced and automated sensor selection procedures • This has been one of the goals for the PXL construction project but has not been implemented yet
Noise and FPN measured in Ultimate 2 sensors • 8 wafers
Noise and FPN measured in Ultimate 2 sensors • wafer 501
Noise and FPN measured in Ultimate 2 sensors • wafers 201-205
Noise and FPN measured in Ultimate 2 sensors • wafers 303-304
Yield and wafer maps – wafer 201,202 Vref2 high Vref2 low • Wafer 201: • good: 35 73% • bad: 10 21% • (?): 3 6% • Wafer 202: • good: 36 75% • bad: 8 17% • (?): 4 8% High VCLP High power
Yield and wafer maps – wafer 203,204 Vref2 high Vref2 low • Wafer 203: • good: 12 25% • bad: 35 73% • (?): 1 2% • Wafer 204: • good: 26 54% • bad: 19 40% • (?): 3 6% High VCLP High power
Yield and wafer maps – wafer 205 Vref2 high Vref2 low • Wafer 205: • good: 35 73% • bad: 12 25% • (?): 1 2% High VCLP High power
Yield and wafer maps – 2 DRIE wafers Vref2 high Vref2 low • Wafer 303: • good: 33 69% • bad: 13 27% • (?): 2 4% • Wafer 304: • good: 36 75% • bad: 11 23% • (?): 1 2% Failed 160 MHz High VCLP High power Not in DB: A01, A02, B01, C01, C02, C03