Interactive Perception-Based Model for Characterizing Display Devices
230 likes | 373 Vues
This paper presents a novel perception-based model for the reliable characterization of display devices through human observation. It addresses the limitations of previous models by employing relative measurements and optimizing the tone reproduction curve (TRC). By incorporating additive RGB channels and considering environmental and side effects, our method improves accuracy in the characterization process. The results demonstrate acceptable accuracy compared to spectrophotometer measurements, highlighting the potential of human-based TRC measurements as a cost-effective solution for display device characterization.

Interactive Perception-Based Model for Characterizing Display Devices
E N D
Presentation Transcript
An Interactive Perception Based Model for Characterization of Display Devices Attila Neumann1, Alessandro Artusi1, Georg Zotti1, László Neumann2, Werner Purgathofer1 1 Institute of Computer Graphics and Algorithms Vienna University of Technology, Austria 2Grup de Gràfics de Girona, Universitat de Girona, Spain
Motivation Reliable characterization of display By a measuring device By human observation
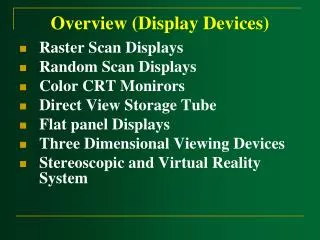
Colors of the display • Additive RGB channels • characteristics separable by channel • Side effects • slight cross effects (stronger for LCD) • environmental effects • Pipeline • graphics card [byte] • display device [voltage] • eye [luminance] • brain [color appearance]
Tone Reproduction Curve byte → luminance(by channel)
Previous Work – Models for the TRC • Models with small number of parameters • Linear functions: GOG, version 1.x IEC GGO, version 2.x 3.x IEC GOGO • [Berns et al. 1993] • Non linear functions: LIN-LIN2, LOG-LIN, LOG-LIN2, LOG-LOG, LOG-LOG2 • [Post and Calhoun 1989], [Katoh and Deguchi 1998] • S-curve (S-shaped function): handling cross effect (mainly at LCD monitors) • [Kwak MacDonald 2001], [Miyake et al. 1990] • Arbitrary number of parameters • Masking model (spline) • [Tamura et al. 2003]
Our method • Basic measurement steps • Human observations • Errors are tolerable and can be reduced • Relative measurements • Finding the input values (instead of output values) • Automatic stop and setup of basic steps • Optimization (definition of the TRC function) • Generic function is achieved • A relative curve is defined • Passes requirements of human perception
Basic step Similar to classic gamma applet
Basic step Similar to classic gamma applet
Basic step Similar to classic gamma applet
Basic step Similar to classic gamma applet
Basic step Similar to classic gamma applet
Basic step Similar to classic gamma applet
The math problem • No direct measurements for f(x) • onlyrelative measurements ((x0, x2, r), x1) • diff = y1‘-y1 = rf(x0)+(1-r)f(x2)-f(x1)depends on the unknowny=f(x) TRC • Optimum criteria for the y=f(x) TRC • y‘-y expressions are to be minimized • instead of the usual yi=f(xi) i.e. diffi=0 !! • other targets can be defined • smoothness condition • repeatable measurements
The compound minimum problem f(i) [i=0..255] are unknown Measurement conditions: M(j) = rjf(lowj)+(1-rj)f(highj)-f(backj) [j=1..N] Smoothness conditions: S(i) = f(i+1)+f(i-1)-2f(i) [i=1..254] Convex quadratic minimum problem F = i=1..N mjM(j)2 + i=1..254 siS(i)2 Minimized by a conjugate gradient method
Additional questions • Setting the coefficients • weights m and s control the behaviour of f • Definition of triplets (lowi, highi, ratioi) • predefined triplets • optimal ‚next triplet‘, stop criterium • defined by the local and/or overall reliability • LOG-LOG coordinate system • Seems more natural • power function transformed to linear function • Additional degree of freedom • But: numerical and algorithmic problems
Results • CRT monitor • R,G,B results by our method • Compared to simple power function • Perceivable deviation Derivative can deviate upto 0.4-0.6 !
Results • Compared to spectro-photometer measurements • Absolute/relative data conversion • Accuracy acceptable • Mutual verification
Conclusion, future work + Human based TRC measurement • Cheap solution • New implicit approach + Complements existing methods • Traditional gamma applet • Masking model [Tamura 2003] ? Missing absolute luminance values • By channel, cross effects • contrast value by human observation ? Preferring LOG-LOG type functions • Instead of spline-like (LIN-LIN) functions ? Combining with other methods (LIN-LIN, etc)
Acknowledgements • Supported by • European Union: RealReflect Project • IST-2001-34744 • „Realtime Visualization of Complex Behaviour in Virtual Prototyping“ • Spanish Government • TIC2001-2416-C03-01 • Helped with implementation • Benjamin Roch (TU Vienna, Austria) • Wolfgang Deix (TU Vienna, Austria)
Thank you for your attention aneumann@cg.tuwien.ac.at