Abstract:
Layer 1. Layer 2. Layer 3. Layer 4. K x (ft/Day). 40. 10.0. 75. 75. K y (ft/Day). 40. 10.0. 30. 30. K z (ft/Day). 0.4. 0.01. 0.30. 0.30. S s ( /ft). 00001. 0.0001. 0.0001. 0.0001. S y. 0.20. 0.20. 0.20. 0.20. Effective Porosity. 0.30. 0.15. 0.30. 0.30.

Abstract:
E N D
Presentation Transcript
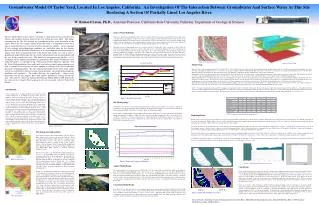
Layer 1 Layer 2 Layer 3 Layer 4 Kx (ft/Day) 40 10.0 75 75 Ky (ft/Day) 40 10.0 30 30 Kz (ft/Day) 0.4 0.01 0.30 0.30 Ss ( /ft) 00001 0.0001 0.0001 0.0001 Sy 0.20 0.20 0.20 0.20 Effective Porosity 0.30 0.15 0.30 0.30 Total Porosity 0.32 0.40 0.35 0.35 Groundwater Model Of Taylor Yard, Located In Los Angeles, California. An Investigation Of The Interaction Between Groundwater And Surface Water At This Site Bordering A Section Of Partially Lined Los Angeles River. W. Richard Laton, Ph.D., Assistant Professor, California State University, Fullerton, Department of Geological Sciences Abstract: The Los Angeles River in Los Angeles, California is a focal point of concern for both area citizens and regulators because much of the river bottom has been lined. This lining, constructed in the 30’s has changed the groundwater-surface water interaction in the region. Where the river remains unlined or partially lined, it is important to know what type of interaction the river is having with local groundwater aquifers. An investigation of local geologic and hydrogeologic conditions was undertaken along the Los Angeles River near the Taylor (Railroad) Yard because of its recent importance to future change in landuse. Data from six monitoring wells at the Taylor Yard facility was used to create a groundwater model which represents the current interaction between that local aquifer and the river in this partially lined area. The model was constructed using Modflow, a U.S. Geological Survey modular finite-difference groundwater flow model. Groundwater flow within the aquifer was simulated using a block-centered finite difference approach. For the Taylor Yard groundwater flow model only areal recharge and evapotranspiration were used as external stresses because no onsite pumping or recharge wells were in operation during the monitoring period. The three-dimensional model of the Taylor Yard aquifer system was calibrated to conform to known basin geometry and established groundwater conditions and parameters. The model illustrates the groundwater – surface water interaction with the Los Angeles River with shallow groundwater moving towards the river. The relatively short-term study period (February-March 2002) yielded field results that show the Los Angeles River gaining in the area associated with the Taylor Yard Facility. Surface Water Hydrology: Near Taylor Yard exists a partially lined reach of the Los Angeles River which provides an opportunity for the surface water to interact with the groundwater. In this reach of the river, the channel sides are lined with concrete, while the base of the channel remains unlined. The channel bottom consists primarily of gravels and sands with occasional vegetated islands rising slightly above the natural river bottom. During high flow regimes, these areas are inundated with surface water. During the low flow periods, water bifurcates around these islands flowing in channels only a few feet deep. Although a historic stream gauging station was located along the Los Angeles River just downstream of Taylor Yard, the historical stream-gauging site data was not used for this study since it was disabled during the late 1980’s. Monitoring the river levels during rainfall events was deemed important to the overall understanding of the groundwater-surface water interaction and thus was included as part of the study. During the groundwater-monitoring period of the study (February 5 through March 13, 2002), Miller Brooks Environmental, Inc. monitored the surface water elevation in the river at three different times in association with rainfall events (2/18/2002, 3/12/2002, and 3/17/2002). Monitoring was done at six predetermined location along the river’s reach. Figure 3: River Elevation Graph, shows the measurements for each event. Figure 5: Modeled Boundaries Figure 6: Model Setup Model Setup: Layer 1: The first layer (approximately 350 to 380 feet [106.7 to 115.8 m] above mean sea level) is defined as extending from the ground surface to the top of a finer-grained material that blankets the entire site. This layer ranges in thickness from 1 to 7 feet (0.3 to 2.1 m) and is mainly comprised of fill material. This layer is part of the vadose zone and does not contain any groundwater; however, the layer does influence recharge from precipitation. The vertical movement of groundwater is impeded by the fine-grained nature of this compacted material. Layer 2: The second layer (approximately 340 to 360 feet [103.6 to 109.7 m] above mean sea level) consists of a fine-grained layer that was found in each boring log recorded on site. The material is described as a silty to sandy clay ranging in thickness from 1 to 28 feet (0.3 to 8.5 m). Layer 2 is also located above the water table and acts to slow recharge to the water table via precipitation. Layer 3: The third layer is a fictional layer that was used for defining the movement of water in the upper portions of the unconfined aquifer. Layer 3 is used to help further define the interaction of the river with the local aquifer system. This layer is located at a depth just below the river bottom elevation (298 feet [90.1 m] above mean sea level) and serves to tighten the grid in the area beneath the river. For modeling purposes, the layer was modeled to be a uniform 1-foot (0.3 m) in thickness across the entire modeled region. The hydrogeological characteristics of this layer are the same as Layer 4. Layer 4: The fourth layer modeled represents the main groundwater aquifer at the site, and extends from beneath Layer 3 to a depth of 200 feet (71 m) above mean sea level. The aquifer thickness is approximately 150 feet (45.7 m). The based of Layer 4 was defined as the underlying bedrock formation. Note that the actual aquifer includes Layers 3 and 4. Table 1: “Summary of hydraulic model parameters” summarizes the parameters used for each layer of the model. The layer thicknesses varied with location throughout the modeled area. It should be noted that Layer 2 has a lower hydraulic conductivity in comparison to the others, but is located above groundwater within the vadose zone of the subject site. Layers 3 and 4 have identical hydraulic characteristics and therefore no real boundary exists between them. The introduction of Layer 3 to the model was done to identify small changes in groundwater flow beneath, and potentially into or out of the river. Introduction: The Los Angeles River is highly modified, having been lined with concrete along most of its length by the U.S. Army Corps of Engineers between the 1930s and the 1960s. However, sections of the river remain only partially lined. One of the partially lined areas is located in the City of Los Angeles, adjacent to the Taylor Railroad Yard (see Figure 1: Taylor Yard). The partial lining of this reach of the Los Angeles River provides an opportunity for the surface water to interact with the local groundwater. Taylor Yard has been under recent consideration for redevelopment; however, prior to final redevelopment decisions, concern existed regarding the potential for the adjacent Los Angeles River to affect redevelopment plans. Therefore, a groundwater model was constructed to determine the nature of current interaction between the local aquifer system and the river. Model construction required a thorough search of site historical records and environmental reports to establish a basic understanding of the site hydrogeology and geologic properties. The hydrogeologic, hydraulic, and geologic properties were then used to define the input parameters utilized in the Taylor Yard groundwater model. Figure 3: River Elevation Graph Site Hydrogeology: Groundwater in the Narrows occurs under unconfined conditions, with a regional gradient to the southeast. Significant groundwater is present beneath Taylor Yard, primarily in the Gaspur Aquifer, which is located at the base of the recent fluvial sediments (CDWR, 1961; Upper Los Angeles River Area Watermaster, 2000). Six automatic recording transducers were installed within the Taylor Yard property to collect groundwater elevation data during from February 5 to March 13, 2002. The wells selected for this study included W-1, W-11, W-19, W-23, W-31, and W-32. The purpose of the data collection was to evaluate fluctuations in groundwater elevations in response to precipitation events and in response to fluctuations in surface water flow in the Los Angeles River. (See Figure 4: Taylor Yard Groundwater Elevations) Table 1: Summary of hydraulic model parameters Modeling Results: Model output consists of steady-state groundwater contours by layer throughout the modeled region. The model also calculates which cells are dry (either had no pre-existing water or were drained of all water) at the end of the simulation. Model output for Layers 1 and 2 indicated that these layers remained dry throughout the simulation, with the exception of the river reach area, in which water was illustrated flowing within the upper two layers. These results are consistent with observed conditions. Layer 3 model output shows groundwater flow contours that move from the upgradient side (northwest) of the site to the downgradient (southeast) side (see Figure 7: Modeled Flow within Layers 3 and 4). Note the customary up-river v-shaped contours, which are associated with gaining streams. This is evidence that the river is gaining in this very shallow section of the aquifer. Model Layer 3 represents the uppermost portion of the groundwater aquifer, while underlying Layer 4 is more representative of regional groundwater flow conditions. Layer 4 model output shows groundwater contours which resemble previous published groundwater contours for the Taylor Yard site, with flow moving from the northwest to the southeast unimpeded by the interaction of the river with the shallower groundwater near the river(see Figure 7: Modeled Flow within Layers 3 and 4). This is more representative of expected regional groundwater flow conditions. It should be noted that the model was only calibrated to conditions that existed during the study period. This monitoring period was unusually dry (little to no precipitation) and thus the outcome may be skewed. In fact, it is very likely that conditions can and do change with time due to the overall dynamics of the river system. Figure 1: Taylor Yard Site Background and Geology: Taylor Yard is located on the eastern boundary of the Los Angeles River within a reach of the river known as the “Narrows”, which lies between the San Fernando Valley and the Los Angeles Coastal Plain. The Narrows portion of the river is a steep-sided valley approximately five miles in length, located on the southeast portion of the San Fernando Valley, between the Elysian Hills and Santa Monica Mountains to the west and the Repetto Hills to the east (Metropolitan Water District of Southern California [MWDSC], 1987). The Narrows consists of an alluvium-filled valley resulting from erosion of the surrounding hills and alluvial fans and the subsequent deposition of these sediments by the ancestral Los Angeles River (see Figure 2: Site Geology). The water-bearing alluvium within the Narrows is Quaternary in age and is underlain by non-water-bearing bedrock of Tertiary age. Soil overlying bedrock in the Narrows consists primarily of highly permeable sand and gravel with a maximum thickness of approximately 200 feet (60.1 meters; California Department of Water Resources [CDWR], 1961). Results of environmental investigations conducted at Taylor Yard to date indicate that subsurface soils in the Active Yard generally consist of fill material extending from the ground surface to a depth of approximately 7 feet (2.1 m) below ground surface (bgs), and sands and silty sands with minor discontinuous clayey sands extending from 7 to 35 feet (2.1 to 10.7 m) bgs. These sediments are underlain by gravelly sand and generally coarse-grained sediments from 35 to 44 feet (10.7 – 13.4 m) bgs. Below 55 feet (16.8 m) bgs, the coarse sand and gravel content increases with depth to 100 feet (30.48 m) bgs (maximum depth of investigation). Cobble layers of varying thickness are also found below 55 feet (16.7 m). Clay or silt zones of less than 5 feet (1.5 m) in thickness were observed between 60 and 70 feet bgs (18.3 and 21.3 m; ERM, 2000a). Figure 2: Site Geology Figure 4: Taylor Yard Groundwater Elevations Figure 8: Groundwater Flow in cross-section Aquifer Model Design: The computer model used for this project was MODFLOW, a U.S. Geological Surveymodular finite-difference groundwater flow model (McDonald and Harbaugh, 1988). The software used to model the subject site was Visual MODFLOW2.3 (Version 2.8.2.52) by Waterloo Hydrogeologic, Inc. Use of the Visual MODFLOW model requires selection of various hydrogeological and climatic input parameters, which were determined through either on-site data collection or literature review. For this study, groundwater elevations of the water table aquifer and the hydrostratigraphic layers within the subject site were used in conjunction with precipitation and river stage data to produce a working three-dimensional groundwater flow model. Conceptual Model Design: Basic Model Design: The modeled area covers a square-shaped region of approximately 4,680 by 4,659 feet (1426.5 to 1420 m)(see Figure 5: Modeled Boundaries). The model was divided into four distinct vertical hydrostratigraphic layers which vary in thickness and geologic makeup (see Figure 6: Model Setup). The lateral and vertical extent of each layer was constructed from boring log records contained in various site reports (ERM, 1998, 1999, 2000, and 2001). Hydrogeologic parameters for the four distinct vertical layers of the model are discussed later. Conclusions: Based on the measured surface water levels in the Los Angeles River, and the groundwater levels obtained from wells in Taylor Yard, it appears that shallow groundwater and surface water are in communication (see Figure 8: Groundwater Flow in cross-section). Results of the calibrated MODFLOW model also indicate that communication between the surface water of the river and the associated aquifer system did exist for the monitored period. In the very upper portion of the aquifer, the model demonstrates the reach of the river in the study area is gaining (groundwater is moving into the river). However, moving downward, the model indicates that groundwater begins to move through the aquifer system with little to no effect on or from the surface water system. Based on the results of this investigation, further detailed modeling pertaining to the fate and transport of environmentally degraded groundwater present beneath Taylor Yard is warranted for risk assessment to the aquifer and potential new land uses. Results of this investigation should be confirmed by installing downgradient wells with discrete screened intervals in hydrostratigraphic Layer 4 to verify model findings. A longer period of monitoring should be considered, along with a more detailed survey of the river bottom profile (since the river bottom elevation model input was an assumption based on surface water elevation). This information would prove beneficial to future studies of the Taylor Yard property. Layer 3 Layer 4 Figure 7: Modeled Flow within Layers 3 and 4 Elevation Model Special thanks: California Coastal Commission; Friends of LA River; Miller Brooks Environmental, Inc. (Elizabeth Robbins, RG); CSUF Graduate Students Sean Hunt and Rene Perez