
Uploaded by
urielle-jenkins
4 SLIDES
113 VUES
40LIKES
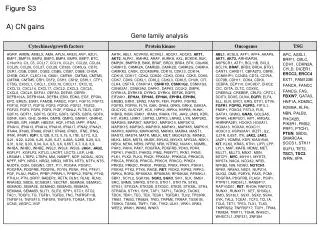
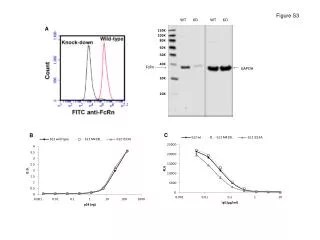
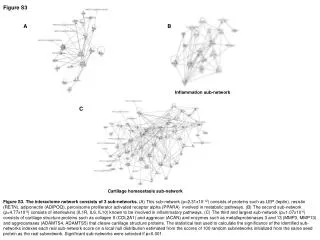
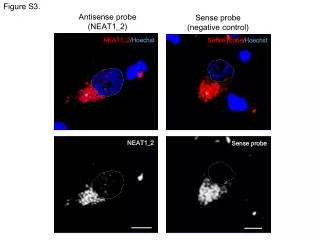
Integrated Analysis of Copy Number Alterations in Gene Families, Pathways, and Network Processes
DESCRIPTION
This study provides a comprehensive analysis of copy number alterations (CNAs) in gene families, pathways, and network processes to understand the interconnectedness and potential implications. We explore CN gains and losses using a multi-level approach, shedding light on the molecular mechanisms underlying these alterations.
Download
1 / 4
Télécharger la présentation 
Integrated Analysis of Copy Number Alterations in Gene Families, Pathways, and Network Processes
An Image/Link below is provided (as is) to download presentation
Download Policy: Content on the Website is provided to you AS IS for your information and personal use and may not be sold / licensed / shared on other websites without getting consent from its author.
Content is provided to you AS IS for your information and personal use only.
Download presentation by click this link.
While downloading, if for some reason you are not able to download a presentation, the publisher may have deleted the file from their server.
During download, if you can't get a presentation, the file might be deleted by the publisher.
E N D


More Related
Audio
Live Player