Visualization-Driven Analysis of Maintenance Task Scenarios for Enhanced Decision Making
The study explores innovative visualization techniques to facilitate complex maintenance task analysis. Driven by challenges in automating maintenance tasks and the need for effective multi-criteria decision-making, we propose interactive visualization tools to support human analysts in feature location, anomaly detection, and component identification. Our approach emphasizes defining interaction scenarios through graphical representations, mapping data to visual attributes, and fostering flexibility in user interactions. By illustrating the transformation of analysis tasks into visual scenarios, we aim to enhance understanding and scalability in maintenance operations.

Visualization-Driven Analysis of Maintenance Task Scenarios for Enhanced Decision Making
E N D
Presentation Transcript
Generating Visualization-based Analysis Scenarios from Maintenance Task Descriptions Salima Hassaine, Karim Dhambri, Houari Sahraoui, Pierre Poulin DIRO, Université de Montréal
Motivation • Many maintenance tasks difficult to automate • Multi-criteria decision making • Feature location (traceability), anomaly detection, aspect mining, component identification, etc. • Lack of contextual information • Feature location, quality assessment, anomaly detection, evolution analysis, reverse engineering, etc. • Complexity/scalability • Feature location, quality assessment, anomaly detection, evolution analysis, reverse engineering, etc.
Motivations • Interactive visualization • Maintenance task = Set of reasoning and calculation modules • Set of automated modules AMs (explicit knowledge) • Human analyst module HM • Visualization = Interface between AMs and HM Visualization
Motivations • How to us visualization tools?
Motivations • How to us visualization tools? • Creating views • Mapping data to graphical objects and attributes • Different degrees of freedom • Fully defined by the tool designer • Customized by parameter setting • More flexibility • Interacting with views • Mapping data-analysis operations to sequences of interactions
Approach Overview AT to IVT Transformation Mechanism Interactive Visualization Task Model Analysis Task Model Edition Execution Conformance AT to IVT Transformation Session Analysis Task Model Interactive Visual Task Customization Tool Specification
Example • Blob Detection • Task description
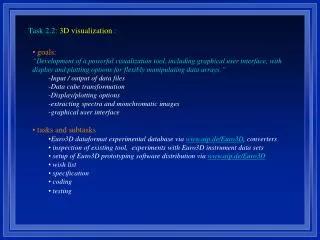
Interactive-Visualization Task Model • Tool specification • Example of VERSO h c t
AT to IVT Transformation • Defining views (case of parameter setting) • Map data into graphical attributes • Constraint solving problem
AT to IVT Transformation • Defining interaction scenarios • Mapping operators into interactors (two steps)
Example • Blob Detection • Interaction scenario
Example • Blob Detection
Conclusion • A preliminary work on how to map a maintenance task to an interaction scenario with a visualization tool • Limitations & Future work • Relationship between data and operation mappings • Data-distribution impact on the mapping • Tool-nature impact on the mapping • Case of multiple views • Experimentation with other visualization tools