Download
1 / 29
290 likes | 405 Vues
An evaluation model based on TOPMODEL for catchment-scale runoff modeling responses to climate change. Yanli LIU Nanjing Hydraulic Research Institute Research Center for Climate Change, the Ministry of Water Resources, China 21/11/2010. Objective.

E N D
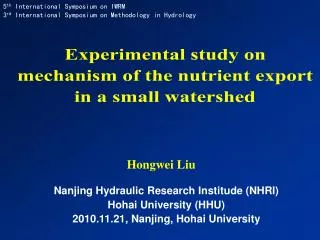
An evaluation model based on TOPMODEL for catchment-scale runoff modeling responses to climate change Yanli LIU Nanjing Hydraulic Research Institute Research Center for Climate Change, the Ministry of Water Resources, China 21/11/2010
Objective Since TOPMODEL could quantitatively describe subgrid variability in soil moisture impacted by topography, requiring fewer parameters, TOPMODEL may perform better than VIC when incorporating with land surface model (Warrach K,2002) The goal of this research is to establish an evaluation model for assessing impacts of climate change for hydrological processing, based on TOPMODEL and coupling with essential techniques.
Outline An evaluation model ---based on TOPMODEL Future projections of CC processing Model calibration---GLUE Study case and data sets Results and Discussion Conclusions
TOPMODEL --- a topographically based semi-distributed hydrological model background theory --- variable contributing area concept The surface flow mainly generate from saturated area, which is subject to topography, hydraulic characteristic and antecedent precipitation of catchment. • Beven和Kirkb Proposed by Beven and Kirkb,1979 Then developed and widely used all over the world Prof. Keith Beven
Same Topography index ---same hydrological response • Distribution
P P qo qr qs • variable contributing • area concept
A hydrological model==an evaluation model of climate change impacts on hydrology?? • Model changes: • Time scale: one hour (several hours)---day • Space scale: below 1000km2---above 10,000km2
Outlines An evaluation model ---based on TOPMODEL Future projections of CC processing Model calibration---GLUE Study case and data sets Results and Discussion Conclusions
Delta change method where is average of the projection series from GCM.
Outline An evaluation model ---based on TOPMODEL Future projections of CC processing Model calibration---GLUE Study case and data sets Results and Discussion Conclusions
GLUE---Generalised Likelihood Uncertainty Estimation • (1)Likelihood measures definition • (2)Parameters range and prior distributions • predetermined • (3)Likelihood calculation----threshold---behavior • runs • (4) posterior distribution of parameters • (5) Output (prediction bounds--confidence)
Outline An evaluation model ---based on TOPMODEL Future projections of CC processing Model calibration---GLUE Study case and data sets Results and Discussion Conclusions
Schematic of study area 10190 km2
Baseline period: 1961.3-1991.2 (water year) • daily ---precipitation, evaporation, flow • Future climate: 2021.3-2051.2 • Climate projections: • three SRES emission scenarios (A1B, A2 and B1) and three GCMs (CSRIO, NCAR and MPI), -----seven simulations
Outline An evaluation model ---based on TOPMODEL Future projections of CC processing Model calibration---GLUE Study case and data sets Results and Discussion Conclusions
>0) AND ( <0.10) • ------- 749 captured behavioral runs
Flow simulation of 90% confidence bound (partly) during baseline period
the 90% confidence bound is quite narrow • if <0.10 then >0.6 • all the behavioral runs could perform in simulating process without notable differences • one accepted parameter group could be selected for relatively better performance
Variations of the observed and simulated monthly flow process during the baseline period
The comparison of observation and GCMs simulations during baseline period The comparison of observation and GCMs simulations during baseline period The differences of each GCM between baseline period and future
The annual average runoff changes between baseline period and future
The average monthly runoff changes between baseline period and future
Annual runoff variation: • -12.2% (CSIRO-A2) ------8.6% (NCAR-A1B), the smallest one 2.1% (MPI-A1B). • 5 projections indicating increasing---- 2 decreasing • Average monthly runoff: • the largest change would occur in Feb. from -37.9% to 34.5%. • Projections CSIRO-A1B and CSIRO-A2 show decline for monthly series • the other 5 projections show ascending trend with different levels • But it indicates a non-direct proportion line relationship between more moisture warming weather and more runoff, and non-uniform distribution in seasons.
Outline An evaluation model ---based on TOPMODEL Future projections of CC processing Model calibration---GLUE Study case and data sets Results and Discussion Conclusions
It showed good performance in a large scale catchment runoff modeling as large as 10,000 km2, and could be applied to climate change assessment reasonably and reliably. • These results suggest notable impacts on water resources planning and utilization, and possible more extreme events such as drought and flood in the future period from 03/2021 to 02/2051. • It is worth noting that due to the remarkable uncertainty of GCMs, the projections of this study for runoff changes are full of uncertainty as well.
Until more probabilistic climate change scenarios or multiple ensemble runs from many GCMs are available, it is difficult to assess any likelihood of a particular projected change. • It suggests a risk management framework aiming at the uncertainty of future projections for water resources management.