Download
1 / 14
140 likes | 235 Vues
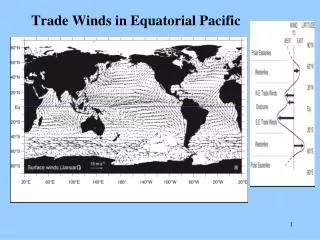
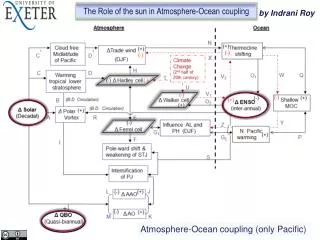
Coupling of Equatorial Pacific Conditions with Southeast U.S. River Discharge. Lawrence B. Cahoon Dept. of Biology and Marine Biology UNC Wilmington. Correlations – Climate Indices.

E N D
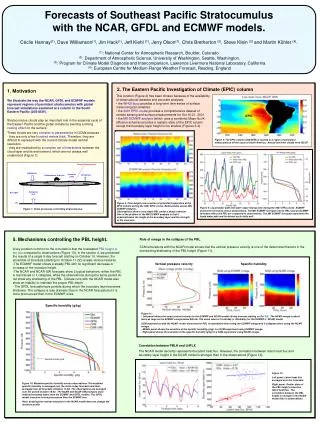
Coupling of Equatorial Pacific Conditions with Southeast U.S. River Discharge Lawrence B. Cahoon Dept. of Biology and Marine Biology UNC Wilmington
Correlations – Climate Indices Coefficients (r2) from least-squares linear regressions of river discharges (USGS data) vs. “major” NH climate indices; * = r2< 0.01. ________________________________________________ “Major” NH Indices River PDO NAO AMO James * * * Cape Fear * * * Savannah * * 0.017 _________________________________________
Correlations – ENSO Indices Coefficients (r2) from least-squares linear regressions of river discharges (USGS data) vs. ENSO indices; * = r2 < 0.01. _______________________________________________________________ ENSO Indices River SOI BEST MEI James * * 0.02 Cape Fear * * * Savannah 0.02 0.02 0.02 _______________________________________________________________
Correlations – ENSO SSTs Coefficients (r2) from least-squares linear regressions of river discharges (USGS data) vs. ENSO SST data; * = r2< 0.01. ______________________________________________________________________ Niño regions River 1+2 3 4 3.4 _________________________________ James 0.27 0.17 * 0.04 Cape Fear 0.16 0.07 * * Savannah 0.16 0.10 * 0.03 ________________________________________
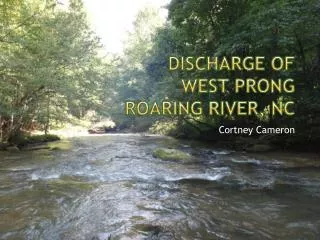
James River (36.9o-37.4oN, 75.8o-76.4oW) (1997-2008) [Chla] v. Flow, r2 = 0.29 DAC@490 v. Flow, r2 = 0.32 WLI@670, r2 = 0.25
Cape Fear River (33.5o-34o N, 78o-78.5o W) (1997-2009) [Chla] v. Flow, r2 = 0.50 DAC@490 v. Flow, r2=0.39 WLI@670, r2 = 0.40
Savannah River (1997-2008)_ (31.5o-32.3oN, 80.3o-81oW) [Chla] v. Flow, r2 = 0.42 DAC@490 v. Flow, r2 = 0.43 WLI@670 v. Flow, r2 = 0.09
Hypothesis/question: • SEUS coastal ocean is coupled with ENSO; can we make useful forecasts?