Phase Changes
This article explores the fundamental concepts of phase changes, including exothermic and endothermic processes. Key phase transitions such as sublimation, vaporization, melting, condensation, and freezing are examined, along with their enthalpy changes (ΔH). We highlight quantitative aspects of phase changes, such as how heat transfer occurs at constant temperature and its relationship with molecular energy. Specific examples include phase diagrams for CO2 and H2O, and calculations demonstrating energy changes when water transitions between different states.


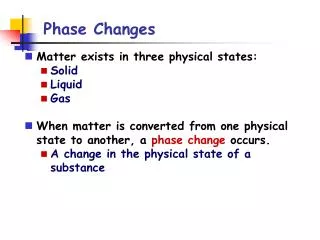
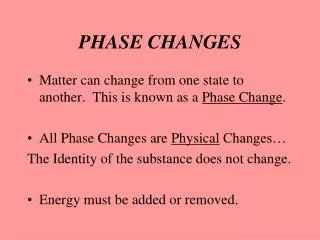
Phase Changes
E N D
Presentation Transcript
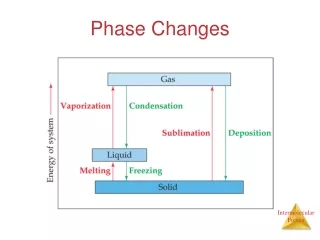
exothermic endothermic Phase Changes sublimination vaporizing melting solid liquid gas condensing freezing
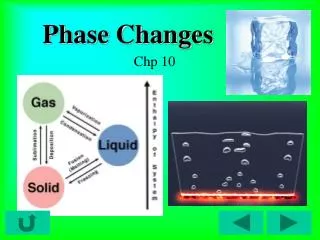
Phase changes and their enthalpy changes. Figure 12.2
Figure 12.1 Heats of vaporization and fusion for several common substances.
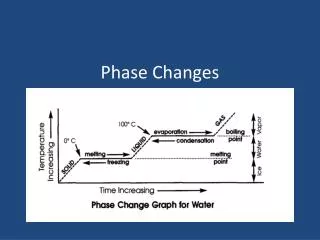
Figure 12.3 A cooling curve for the conversion of gaseous water to ice.
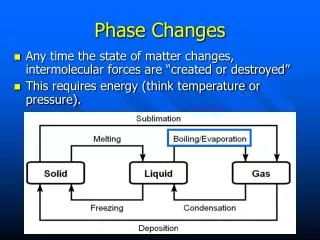
Quantitative Aspects of Phase Changes Within a phase, a change in heat is accompanied by a change in temperature which is associated with a change in average Ek as the most probable speed of the molecules changes. q = (amount)(molar heat capacity or specific heat )(T) During a phase change, a change in heat occurs at a constant temperature, which is associated with a change in Ep, as the average distance between molecules changes. q = (amount)(enthalpy of phase change or ΔH)
Problem • How much energy is transferred when 125 g of water are converted from 25oC to 70oC? To 120oC? ΔHvap = 2.26 kJ/g ΔHfus = 0.33 kJ/g sp.htice = 2.09 J/g oC sp.htwater = 4.18 J/g oC sp.htsteam = 2.10 J/g oC
CO2 H2O Phase diagrams for CO2 and H2O. Figure 12.8