Download
1 / 60
650 likes | 945 Vues
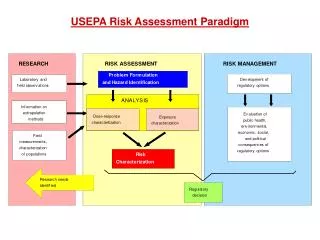
USEPA Risk Assessment Paradigm. Risk Identification : “Qualitative evaluation of the potential for a substance to cause an adverse effect.”. Types of Data used in Developing Exposure & Toxicity Profiles Laboratory data Field Observations Model output QSARs.

E N D
Risk Identification: “Qualitative evaluation of the potential for a substance to cause an adverse effect.”
Types of Data used in Developing Exposure & Toxicity Profiles • Laboratory data • Field Observations • Model output • QSARs
Common Difficulties/Sources of Uncertainty with the Use of Data
Variability of Effects Concentration,EC50 Distribution of Concentrations
What is an Exposure Profile? • Range of concentrations/doses associated with the stressor in time and place • Magnitude in uncertainty due to sampling and/or measurements error • Identify the variability in concentrations and their causes
What is an Ecological Effects Profile • Relationship between stressor level and ecological effect (Dose-Response Relationship) as a function of time and space • Ecological effects can include: single species, populations, multiple species, general trophic levels, communities, ecosystems, landscapes
Risk Estimation for Single Species One Dose – Response Curve – One Species
Uncertainty of Effects Concentrations, e.g LC5 Distribution of Concentrations
Risk Estimation for Single Species Multiple Dose – Response Curves – One Species Cumulative distribution of EC5 Comparison of 50th percentile exposure with EC5
Risk Estimation for Single Species Multiple Dose – Response Curves – One Species Cumulative distribution of EC5 Comparison of 50th percentile exposure with EC5
Distribution of Effects Concentrations among different organisms Distribution of Concentrations
Ecological Effects Profile : Multiple Species Rank Order Method n = rank N = Total Number of observations (6) 100 x n / ( N + 1) 6
Ecological Effects Profile : Multiple Species Statistical Distribution Method
Risk Characterization • Develop an estimate of the risk posed to ecological entities included in the assessment end-points identified in the problem formulation • Describe the risk estimate in the context of the significance of any adverse effects and the strength of evidence supporting it • Qualify the risk estimates by summarizing uncertainties and assumptions.
Strengths: • Estimates likelihood that a certain percentage of species may be adversely affected. • But: • consider whether the subset of species for which toxicity test are available represent the range of species present in the environment • consider whether particular sensitive groups of organisms are included • If a criterion is selected, often protect 95% of the species, consider whether the 5% potentially affected organisms are of ecological, commercial or recreational significance
Mixtures of Chemicals • PCBs • Chlorinated dibenzo-p-dioxins • Chlorinated dibenzo-furans • Chlorinated diphenyl ethers • Polychlorinated naphthalenes • PBBs • Polybrominated diphenyl ethers
Toxic Responses • Body weight loss • thymus atrophy • impairment of immune response • hepatotoxicity • early life stage mortality • delayed response • disruption of the endocrine system • changes in vitamin A levels • neurotoxicity • teratogenicity • carcinogenicity
Structure-Activity Relationship for “dioxin- like” compounds 10 A 4 A • Planarity • electronegative substituents groups in the corners
Additivity Chemical Concentration (ng/kg) TEF TEQ(ng/kg) 2,3,7,8-TCDD 10 1 10 3,3’,4,4’,5-PCB 1000 0.005 5 2,3,7,8-TCDF 100 0.028 2.8 Mixture 1110 17.8
A Probabilistic Risk Assessment of the Reproductive Effects of Polychlorinated Biphenyls, Dibenzo-p-dioxins and Dibenzofurans in Lake Ontario Lake Trout Stocks Frank A.P.C. Gobas1, *Cherie M. Gelowitz1, Philip M. Cook2, Susan Y. Huestis3, Mark R. Servos4